CCP reviews dashboard of recidivism and jail metrics; members urge more frequent access and deeper measures
Get AI-powered insights, summaries, and transcripts
Subscribe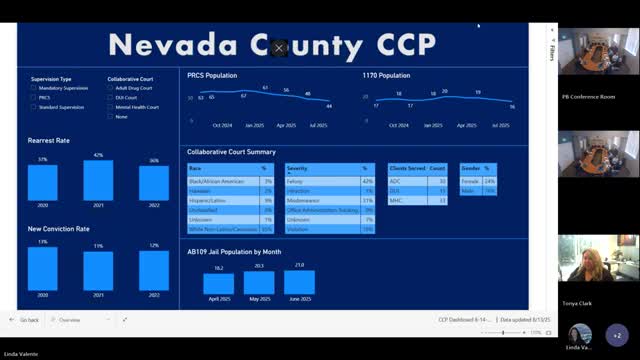
Summary
The group reviewed a Power BI dashboard with rearrest and new-conviction rates, jail population figures and program participation. Members recommended moving toward more frequent distribution, a data warehouse for long-term tracking, and clearer definitions to reconcile discrepancies in mental health court counts.
At a Community Corrections Partnership meeting, staff presented a dashboard that tracks rearrest and new-conviction rates, jail population and other operational metrics and asked members for feedback on improving access and analytic depth.
An analyst from the probation department explained, "So for, like, the rearrest and new conviction rates, I broke out the recidivism into those two data points because there can be some lack of clarity as to what we're talking about." The analyst said cohorts are tracked for two years after entering supervision and that the dashboard currently draws from a manual spreadsheet feed rather than a live data source.
Members recommended a two-step approach: share the dashboard more frequently in PDF form while planning a longer-term move to a data warehouse or live Power BI feed. The group discussed advantages of a de-identified, centralized data store that would allow fuzzy matching across systems (probation, behavioral health, jail records) to reconcile discrepancies and track individuals over time.
Several attendees flagged a specific discrepancy: mental health court counts in the dashboard did not match figures pulled from another case-management report. Staff and Tanya Clark agreed to compare reports offline to identify why numbers differ and to refine the dashboard’s selection criteria.
Other suggestions included adding breakdowns (for example, new convictions by felony versus misdemeanor), tracking contacts that do not lead to booking (such as citations or service calls) and exploring an identifier that would follow a person across systems. Staff offered to circulate the dashboard link or a Power BI file to attendees and to distribute PDF snapshots on an interim basis.
Members agreed that more frequent access and clearer definitions would make the dashboard more useful for budgeting, programmatic decisions and targeted research.