Calaveras County presents District 4 collision analysis, names top corridors for safety work
Get AI-powered insights, summaries, and transcripts
Subscribe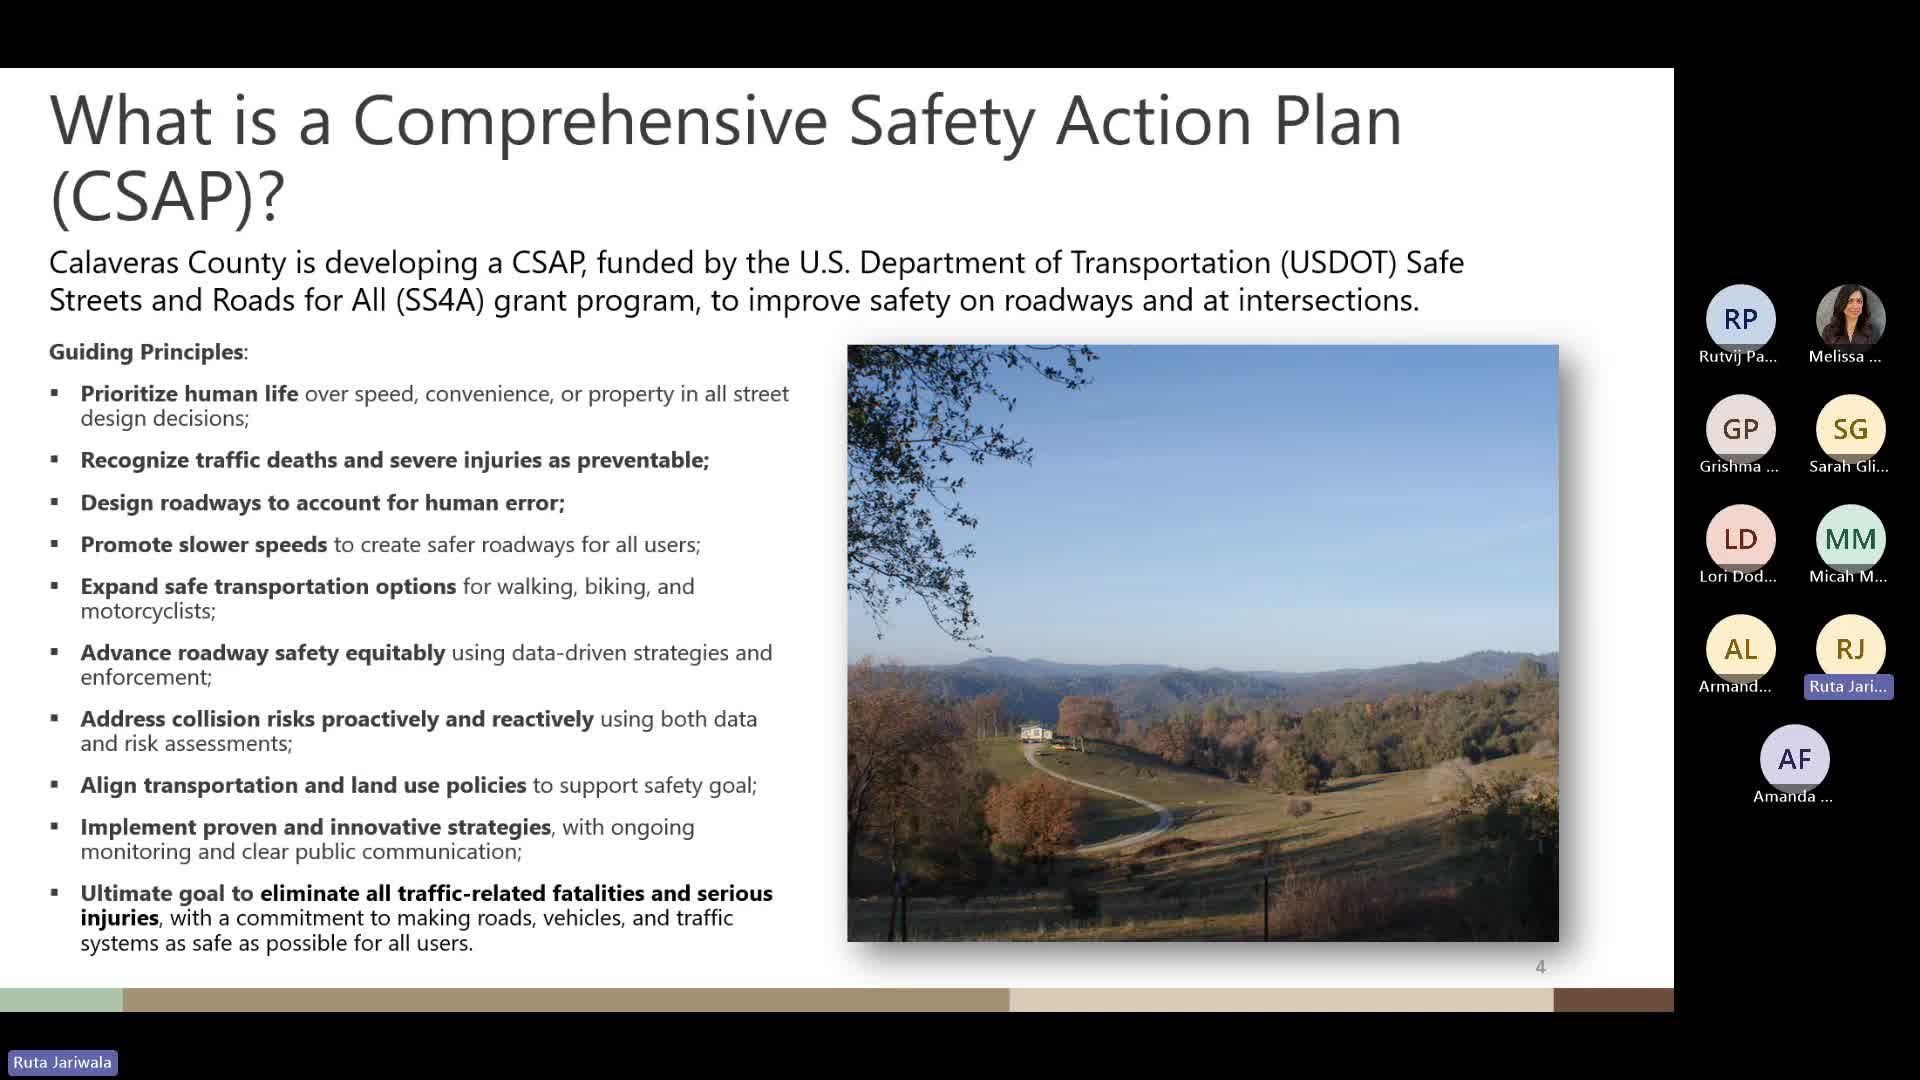
Summary
County project team presented preliminary five-year collision analysis for District 4, identified a high-injury network led by Littlejohn Road, Baldwin Street and Railroad Flat Road, and demonstrated an interactive map and survey for public input as part of a USDOT-funded Comprehensive Safety Action Plan (CASP).
Calaveras County project staff on a virtual community meeting described preliminary findings from a five-year collision analysis and asked residents to use an online map and survey to flag safety concerns in District 4.
Project manager Rutha Jeriwala, of consultant TJKM, said the county’s Comprehensive Safety Action Plan — funded by the U.S. Department of Transportation’s Safe Streets for All grant program — uses data and community outreach to prioritize street and intersection changes.
The plan matters because it targets killed and severe injury collisions (KSI) and will produce a prioritized roster of projects that the county can seek funding to build. "The most important is the guiding principle of this particular plan. It prioritizes human life over speed, convenience, or any property or characteristics of the street," Jeriwala said.
County staff described the analytical approach and the headline results from January 2020 through December 2024. The team reported 356 injury collisions in Calaveras County during the five-year period; 6% were classified as fatal (K), 21% as severe injury (SI), 46% as visible injury and 27% as complaint-of-pain crashes. The analysis excluded Caltrans-maintained facilities such as SR 4, SR 26 and SR 49.
The county said KSI collisions were more likely to occur on roadway segments than at intersections (71% segment vs. 29% intersection). By mode, KSI collisions involved passenger cars and pickup trucks in 52% of cases, motorcycles in 38%, bicycles in 3% and pedestrians in 2%.
Violation categories that the team identified as most common in KSI collisions were improper turning (41%), driving under the influence (32%) and unsafe speed (14%). Reported collision outcomes included hitting objects (53%), vehicle overturns (27%) and a smaller share described as "hit on" collisions (9%).
The team highlighted motorcycles for further review: 69 injury collisions involved motorcycles countywide. Motorcycle crashes followed the countywide pattern (69% on segments vs. 31% at intersections) and showed higher shares of severe and visible injuries; 30% of motorcycle crashes occurred at night in locations with no street lighting.
Focusing on District 4, staff reported 94 injury collisions in the five-year window. Of those, 12% were fatal, 14% severe injury, 51% visible injury and 23% complaint of pain. The District 4 KSI distribution was similar to the countywide pattern (79% segment vs. 21% intersection). The top three corridors listed for additional study were Littlejohn Road, Baldwin Street and Railroad Flat Road; the team said ten corridors in District 4 are on the high-injury list.
Melissa (senior transportation project manager, GHD) demonstrated the project’s interactive online map and said, "The interactive map allows you to add a location specific comment to the map." Residents can drop markers, choose a mode (walking, bicycling, driving, motorcycling, school-related), attach photos, and submit an email (comments appear public but are shown as anonymous).
Project staff said the CASP process blends reactive data analysis with proactive outreach. The schedule described completion of initial community meetings in other districts, a stakeholder meeting held on 09/16, a winter series of in-person meetings, a spring draft report for stakeholder review and an eventual plan presented to the Board of Supervisors for adoption.
Staff emphasized that the plan will prioritize countermeasures and projects for grant seeking and implementation and will be monitored and adjusted based on outcomes and public input. The project webpage hosts the presentation, meeting schedule, the interactive map and a sign-up form; staff urged residents to use the map and survey to identify locations and safety concerns.
No formal votes or board actions were taken during the meeting; presenters described analysis, outreach tools and next steps for stakeholder review and Board of Supervisors consideration.