Get Full Government Meeting Transcripts, Videos, & Alerts Forever!
Get email alerts on the Student Assessments topic
No spam. Unsubscribe anytime.
Wallingford reports multi-year assessment gains, spotlights sixth-grade dip and rising high-needs population
Summary
At its Sept. 15 Instructional Committee meeting, Wallingford School District staff presented statewide assessment results showing three‑year growth in several grades and subgroups but noted a recurring decline in performance entering sixth grade, rising high-needs enrollment and ongoing attendance concerns.
Wallingford School District staff presented district and subgroup results from the state’s spring assessments at the Instructional Committee meeting Sept. 15, reporting multi‑year increases in percentage of students at or above mastery while flagging a recurring drop in scores when students transition to sixth grade and a steady rise in the district’s high‑needs population.
Ms. Latour, a district staff member who led the presentation, told the committee the packet includes Smarter Balanced (ELA and math), NGSS (science), Connecticut SAT School Day results, and LAS Links (English‑proficiency) data and that the slide deck would be posted on the district website. "As we have done, typically in the beginning months of school, this is our student achievement and growth data related to all of the state of Connecticut's state assessments that we take in the spring," she said.
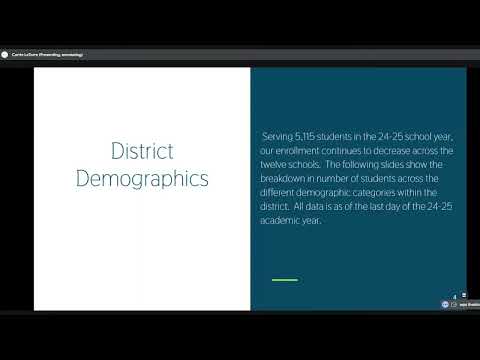
The presentation emphasized both achievement (single‑year snapshots) and growth (rough cohort year‑over‑year results). Districtwide enrollment, Latour said, was about 5,000 students in 2024–25 and has declined by roughly 94 students over three years and about 780 students over 10 years; by contrast, the district’s high‑needs population rose about 2.77% over three years and more than 15% over 10 years.
Nut graf: The test results show gains in many grades and subgroups that district leaders attribute to curriculum revisions, targeted interventions and professional development, but officials said the persistent decline when students move into sixth grade and continuing attendance and resource pressures related to a growing high‑needs population will guide curriculum and intervention priorities this school year.
Key results and how the district is responding
Smarter Balanced (grades 3–8): The district reported three‑year highs in several elementary and middle‑school grade levels for students at or above mastery in English language arts and mathematics. Presenters noted third grade serves as students’ first administration of Smarter Balanced and results often rise as students progress through elementary grades. In math, the presentation cited a third‑grade rate above 60% meeting or exceeding the mastery benchmark for the most recent year; districtwide ELA rates were described as near a 3‑year high (district percentages hover near the 50% range in some grades). Latour said the graphs showing three separate years are not the same cohort each year and clarified later slides used a rough cohort method to track approximately the same students across years.
The committee repeatedly returned to a consistent pattern: scores commonly dip from fifth grade to sixth grade, then tend to rebound in seventh and eighth grade. Latour explained the district sees the sixth‑grade drop across subgroups and said the district is in year three of a new middle‑school schedule and has implemented a new, standards‑aligned curriculum for grades 6–8 this year. "There are a lot of theories as to why that is—transition year, they're changing classes, they're getting used to new structures," she said.
NGSS (grades 5, 8, 11): District results reported 66% at or above mastery in grade 5, 52% in grade 8 and 56% in grade 11. Latour noted NGSS is administered less frequently (students take it in grades 5, 8 and 11) and contains substantial vocabulary and multi‑class content.
LAS Links (English proficiency for multilingual learners): The district reported that 73% of multilingual learners in 2024–25 had been enrolled between one and five years; state research cited in the presentation indicates proficiency in a second language commonly requires five to seven years. Last year the district exited 56 students from ML services, representing about 14% of the multilingual learner population and a larger exit rate than the prior year.
Connecticut SAT School Day (grade 11): The district noted the SAT benchmarks used by the College Board (ELA benchmark 480; math benchmark 530) and said Wallingford’s SAT performance is comparable to state and national participant averages but that mathematics remains consistently lower than English. Committee members and staff discussed national trends, differences in instruction, and multiple possible causes ranging from curriculum coherence to non‑test factors (student health, background knowledge and test‑day conditions).
Attendance and high‑needs population
Members raised attendance as a concern. "Is our truancy and chronically absent... that seems awfully high," asked Mr. Ross, prompting staff to explain definitions and supports. Latour defined chronic absenteeism as students absent for any reason more than 10% of days enrolled and described truancy as four unexcused absences in a rolling 30‑day period or 10+ unexcused absences in a year. She said schools run tiered attendance supports and that attendance data and interventions will be included in school improvement planning.
Interventions, curriculum changes and professional development
District staff described ongoing instructional and intervention work aligned to the data, including: - Curriculum revision in grades 4–5 math, with coherent scope and priority standards and classroom supports; a new middle‑school schedule and standards‑aligned curricula for grades 6–8 in ELA and math this school year. - Targeted intervention programs and tools: MyPath (individualized practice tied to i‑Ready diagnostics), Math 180 (intensive intervention for grade 5+), interim state assessments used for practice and diagnostic alignment, and universal screeners (i‑Ready and DIBELS) given in September, January and May. - Structural instructional time: a flexible small‑group block at elementary and middle schools (about 30 minutes elementary, roughly 42–45 minutes middle school) for targeted instruction without removing tier‑1 core time. - Professional development: Orton‑Gillingham training and morphology work for K–8 intervention staff, a Thinking Classrooms approach in math professional learning, a book study on inclusive math practices for intervention and special‑education staff, and coaching cycles to monitor fidelity of curriculum implementation (including previous K–2 walkthroughs by a reading expert).
Quotes and committee response
Mr. Ross voiced concern about attendance: "Is our truancy and chronically absent... that seems awfully high." Latour replied with definitions and said schools provide multiple supports. Dr. Rasco (committee member) praised the way staff disaggregated the data for multiple subgroups: "I think it shows a really comprehensive view of our district." Latour emphasized that single‑year tests are one data point and that staff weigh daily classroom measures, interim assessments and screening data to plan instruction.
Administrative notes and next steps
Staff said the full slide deck and backup materials will be posted to the district website and that school improvement plans will incorporate the assessment findings and related goals; parents were directed to contact building principals for individualized student data explanations. Committee members were invited to follow up with staff with specific questions.
Votes at a glance
- Acceptance of June 2 minutes — consensus; "aye" called, no opposed or abstentions recorded; motion carries.
Ending
With no further questions the instructional committee adjourned. Staff will continue to use the assessment and screening data to direct curriculum refinements, intervention targeting and professional development this school year.