Get Full Government Meeting Transcripts, Videos, & Alerts Forever!
Get email alerts on the Housing Multifamily topic
No spam. Unsubscribe anytime.
City research shows multifamily stock aging, rents up 35.7% since 2012; rental burden rising
Summary
Arlington planners presented an updated multifamily profile showing an aging apartment stock (average age ~43 years), a 35.7% rise in median monthly rent to about $1,200, and a growing share of renters facing cost burden (57.8% in 2023).
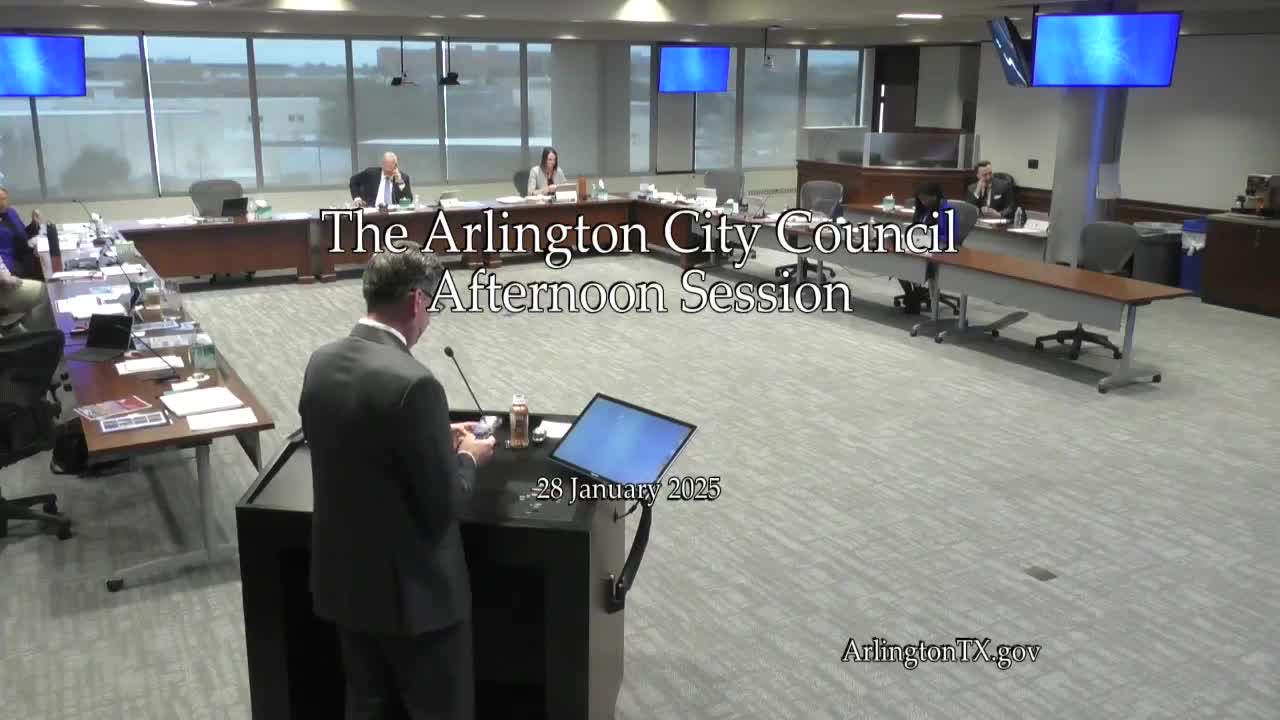
Sarah Stubblefield, manager of strategic initiatives in Arlington’s research and analytics division, presented an updated multifamily housing profile and told the council the city’s multifamily housing is older on average and that rents have risen substantially since the last profile.
The nut graph: the profile pairs with a prior single‑family analysis and is meant to inform policy and code decisions; it shows median rent and income trends, geographic patterns of rent burdens and a limited supply of large multifamily parcels for future redevelopment.
Findings
- Age and stock: Stubblefield said the average multifamily property in Arlington was built around 1981 (roughly 43 years old) and that about 76% of multifamily properties were built between 1970 and 1990.
- Appraised values and parcel size: Of 1,894 multifamily properties the report reviewed, 1,600 are less than one acre; median appraised value across all multifamily was reported at about $283,000 but excluding duplexes the median climbed to $2.2 million because many duplexes are low‑value parcels.
- Rents and affordability: The presentation reported a 35.7% increase in median monthly rent from approximately $892 to about $1,200 between 2012 and 2023. Stubblefield noted that gross rent as a share of household income—a standard measure of affordability—rose from 51% (2012) to 57.8% (2023), meaning an increasing share of renter households are rent burdened (the industry standard flags >30% as burdened).
- Geographic and regional context: The highest rents are concentrated in far north and far southeast census tracts; central and east Arlington show lower rents and incomes. Compared with 10 surrounding cities, Arlington had the fifth‑largest rent increase but the second‑lowest absolute median rent in 2023 among that peer group.
Council discussion
Dr. Oden Wesley asked whether the city had “averted the housing crisis.” Stubblefield replied that affordability pressures remain and that the city’s limited supply of large multifamily parcels and the mismatch between income growth and rent increases make affordability a continuing policy question. She noted some pipeline activity (projects with 50+ units in permitting or planning) but said RMF‑22 zoned acreage is limited.
What this means
Planners and councilmembers can use the profile to prioritize geographic areas for housing programs, to evaluate partnerships with the housing authority on vouchers and to consider land‑use or incentive strategies if the council seeks to produce more affordable multifamily units. Stubblefield said the profile and supporting data are posted on the city’s open data center and that the city will update the analysis as new appraisal and ACS data become available.
Ending
Stubblefield presented the report as an informational update rather than an action item and said staff will return with refined maps and development pipeline updates when 2024 appraisal protest data are fully processed.