Get Full Government Meeting Transcripts, Videos, & Alerts Forever!
Get email alerts on the Special Education topic
No spam. Unsubscribe anytime.
North Ridgeville reports near-state-average special education enrollment, scores 3.93 on state profile
Summary
District special education coordinator Jennie Vance told the Board the district’s special education enrollment (14.86%) is near the Ohio average and that the district earned a 3.93 annual rating from the Ohio Department of Education; staff raised capacity, staffing and inclusion as ongoing needs.
Jennie Vance, special education coordinator for North Ridgeville City Schools, presented the district’s special education profile and annual rating at the Board of Education meeting Tuesday, March 4. She told the board the district identifies 14.86% of students as receiving special education services and reported an overall annual rating of 3.93 from the Ohio Department of Education.
Vance said the district’s percentage of students with identified disabilities is generally in line with state averages and not in an area of concern. "We are not out of bounds," she said. She noted the district is slightly above the state average in the specific learning disability category and described that as a likely driver of the enrollment difference.
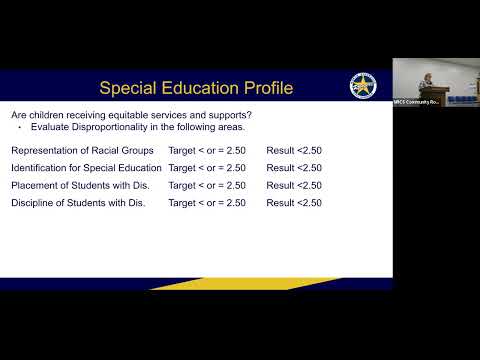
The presentation explained the state’s special education profile questions, including readiness for kindergarten, alternate-assessment participation, postsecondary outcomes and implementation of IDEA (the Individuals with Disabilities Education Act). Vance said North Ridgeville met timelines for early-intervention transition into preschool services and reduced the district’s alternate-assessment participation to below 1% compared with earlier years when it was higher. She said the district’s graduation measure for students with IEPs was 69.23% in the data year reported (the district’s report uses older statewide data cycles). "That number is based on our students that have graduated by meeting the same requirements as their typical peers," she said.
Vance described how much of the district’s lower-than-4 score is the result of data-entry errors rather than service deficits. "Anytime that we have not made the 4...it has been a data error," she said, and noted the district completes corrective-action plans when required. She added that the state is changing how it reports access to general education (one of the profile questions) and that the most recent profile left that field blank because of that change.
Vance also reviewed local capacity and staffing figures: 749 students served on IEPs; 55 students accessing the John Peterson autism scholarship (who receive services under different reporting rules); 504 students with 504 plans; 65 intervention specialists; 84 paraprofessionals; and 24 related-service staff (speech-language pathologists, occupational therapists, physical therapists). She said nine district "ABLE" classroom units are nearly full and that the district should consider adding space or classrooms in coming years to meet demand and increase inclusive opportunities.
Board members asked about recordkeeping, whether parents receive copies of IEPs at graduation and whether outside providers participate in annual IEP reviews. Vance said graduating students receive a summary of performance and copies of their evaluation and IEP and that outside providers participate in annual meetings, often by Zoom. She acknowledged two open staffing positions the district has been trying to fill for months and said the district is balancing 1:1 supports with broader inclusion goals.
Vance closed by thanking staff and urging the board to "see the able and not the label."