Get Full Government Meeting Transcripts, Videos, & Alerts Forever!
Get email alerts on the School Enrollment Projections topic
No spam. Unsubscribe anytime.
UW–Madison demographer: Sun Prairie Area School District enrollment may fall 2% or rise 6% over five years
Summary
David Egan Robertson of the UW–Madison Population Laboratory presented four projection scenarios showing districtwide enrollment could decline about 2% or increase about 6% in five years; impacts vary by grade band with elementary stable, middle school possibly declining and high school showing the largest potential gain.
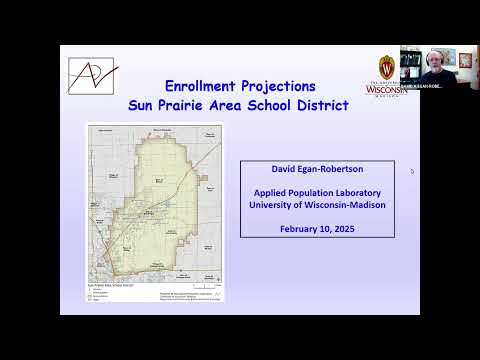
David Egan Robertson, of the UW–Madison Population Laboratory, presented enrollment projections for the Sun Prairie Area School District and said the models show the district’s total enrollment could fall about 2 percent or rise about 6 percent over the next five years. "We produce a range of projections and this is to reflect uncertainty in projections," Robertson said.
The presentation summarized the district’s past decade and the four projection models the lab produced. Over the past 10 years the district added roughly 470 students, about a 6 percent increase, Robertson said. He showed century-long patterns by grade band: 4K declined by about 70 students (roughly 14 percent), kindergarten through fifth grade declined about 100 students (about 3 percent), grades six through eight gained nearly 200 students (about 12 percent) and grades nine through 12 grew by about 450 students (about 19 percent).
Robertson identified three modeling inputs: (1) local birth history, (2) five‑year‑old kindergarten counts and (3) grade progression ratios (GPRs) that capture year‑to‑year changes as cohorts move through grades. He said birth counts in the region have generally stayed between about 500 and 600 per year, and that the district’s kindergarten count for fall 2024 equaled its fall 2015 level. Robertson cautioned that migration is implicit in GPRs rather than explicitly modeled and that projections smooth year‑to‑year volatility.
On open enrollment, Robertson said the district has averaged about 370 open‑enrollment incoming students in the past three years versus about 300 in the prior six years, producing a net open‑enrollment gain of roughly 80 students over the last two years.
The four projection scenarios produced ranges rather than a single forecast. For the five‑year horizon Robertson reported: districtwide enrollment could fall by about 200 students (roughly –2 percent) or increase by about 520 students (roughly +6 percent). By grade band he reported approximate five‑year ranges and numeric changes: elementary (K–5) about –2 to +3 percent (roughly –80 to +90 students); middle school (6–8) about –8 to +4 percent (roughly –145 to +65 students); and high school (9–12) about –2 to +12 percent (roughly –60 to +350 students). Robertson said shorter recent trends (two‑year GPRs and a kindergarten trend) tend to project increases, while longer historic trends (five‑year and baseline using 10 years) lean toward declines.
Robertson summarized: the district’s recent decade shows growth concentrated in upper grades and relative declines in lower grades, births in the area have been generally level, and GPRs are mostly above 1 — meaning cohorts often grow as they advance. He closed by offering to answer questions at an upcoming board meeting. "I will be available at the board meeting on February 10 to answer any questions you might have," he said.
The presentation did not include any formal board actions or votes; Robertson delivered results and methods and did not propose specific policy steps during the recorded remarks.