Gateway SD forecast: resident student population to rise about 4% over five years
Loading...
Summary
A presentation to Gateway SD outlined a spatially driven student enrollment forecast that projects resident enrollment growing from about 3,426 to roughly 3,574 over five years, driven by stable birth cohorts, pockets of residential development and generally high retention rates.
A staff member presenting to Gateway SD projected the district’s resident student population will increase modestly — about 4% — over the next five years, rising from roughly 3,426 to about 3,574 students.
The presentation described a spatially driven forecasting method that combines four years of student address data, birth counts, local residential-development tracking and mobility analysis to model enrollment changes at small “study-area” geographies within the district. “Everything that we do, is very spatially driven,” the staff member said.
Why it matters: the forecast is used to estimate facility utilization, to identify neighborhood-level pockets of growth or decline and to test the enrollment effects of planned housing. The consultant noted the first three to five years of projections are the most reliable because births and known development schedules are better defined in that window.
Key findings and methods - Starting snapshot: the October enrollment snapshot used in the analysis was about 3,426 resident students. The presenter summarized historical trends, mobility and birth cohorts to build the forecast. - Five-year projection: the model projects about a 4% increase (to roughly 3,574 students) over five years if current trends continue. “Anticipating about a 4% growth over the next 5 years,” the presenter said. - Spatial approach: the team geocoded student addresses, digitized attendance boundaries and divided the district into small study areas (split by natural boundaries such as highways) to run forecasts at a fine-grained level. - Birth cohorts and capture rates: birth counts drive kindergarten projections. The presenter said a roughly 77% resident-capture rate was assumed going forward based on recent history; pandemic-year cohort shifts created a noticeable “bubble” in the 2021 kindergarten cohort due to delayed kindergarten entry in 2020. - Mobility and retention: cohort mobility measures were calculated from the four years of student address data. Example metrics discussed included a typical 5% loss when a kindergarten cohort moves to first grade in one attendance area, occasional small gains in other grade transitions (e.g., a 2% gain from second to third in some areas), and generally high retention into upper grades (strong eleventh-to-twelfth retention in the data). - Facility utilization example: Cleveland Elementary (K–4) was given as an example with a functional capacity of 335 and about 292 enrolled, or approximately 87.2% utilization. University Park attendance area was described as showing stable enrollment and utilization (presenter described rates around the low-90s percent in one example). - Residential development: the team tracked active, planned and inactive projects. The presenter said 333 housing units were included in the forecast and another 462 units were recorded as future/planned but not yet included because they lack sufficient information. Single-family detached student-yield was given as 0.0339 (about 34 PK–12 students per 100 single-family units over time); apartment yield was given as 0.07 in one example (used to estimate roughly 30 PK–12 students from a future apartment project when fully occupied).
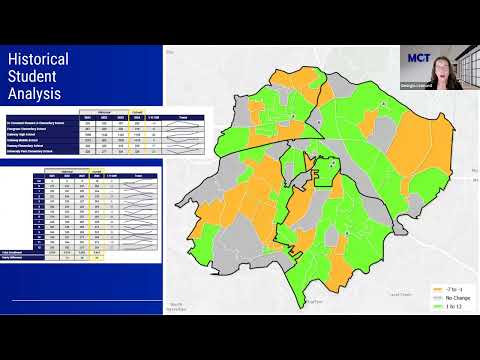
Geographic patterns - Higher student concentrations were mapped in the Evergreen area and in parts of Ramsey and a roughly equidistant area between Cleveland, Stuart and Ramsey, according to the presenter’s density maps. - A five-year neighborhood map in the presentation highlighted small pockets of projected growth (green), small declines (orange/red) and many areas with no projected change (gray); projected losses in study areas were generally small (the presenter described losses of up to about 21 students in a study area as “not very significant”).
Caveats and uncertainty - Short-term reliability: the presenter advised districts to rely most heavily on the first three to five years of the forecast because births and known construction schedules are most certain in that window. - Development timing: some projects are labeled inactive or lack sufficient schedule information; their student yields are monitored but excluded from near-term totals until timing is clearer. - External factors: the presenter noted unpredictable economic or large-employer changes can alter development speed and therefore enrollment trajectories.
Ending: the presenter concluded the forecast shows modest, generally stable growth and high retention for much of the district, with neighborhood-level variation and development-driven pockets of change. “Think spatially,” the presenter advised, summarizing the methodology that underpins the projections.