Get Full Government Meeting Transcripts, Videos, & Alerts Forever!
Get email alerts on the Stock Assessment Basics topic
No spam. Unsubscribe anytime.
Council staff briefed on stock assessment basics, uncertainty, and how outputs feed catch limits
Summary
At a Pacific Fishery Management Council briefing, staff outlined how stock assessment models use data and assumptions to estimate fish population health, described key parameters such as steepness, and explained how control rules and the p* (p‑star) approach are used to set catch limits amid uncertainty.
A staff member for the Pacific Fishery Management Council explained how stock assessment models combine data and assumptions to estimate fish population health and inform catch limits.
The presentation matters because stock assessments are the scientific foundation for management decisions such as Acceptable Biological Catch (ABC) and annual catch limits; the presenter emphasized how data quality, model parameters and quantified uncertainty change assessment outputs and therefore affect management recommendations.
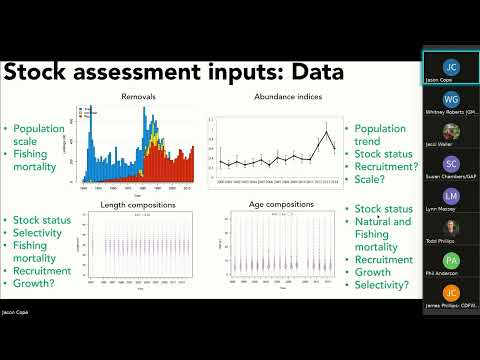
The presenter said, “Stock assessments are a tool using evidence data, insight to help us understand the health of the fish population.” He described the main data inputs — removals (landings and discards), indices of abundance, length compositions and age compositions — and explained what each type contributes to a model’s ability to estimate scale (how many fish exist), status (stock size relative to unfished), and productivity (the population’s ability to replace biomass).
The briefing stressed that models are simplifications of reality and that there is a trade-off between assumptions and data. The presenter noted that when data are sparse or nonrepresentative, models rely more heavily on fixed or prespecified parameters and that model specifications (for example, functional forms for selectivity or stock‑recruitment relationships) shape assessment outcomes.
Using direct examples from the talk, the presenter discussed steepness — the parameter in a Beverton‑Holt stock‑recruitment relationship that describes a stock’s capacity to produce recruits as spawning biomass declines — noting steepness can range numerically from about 0.2 to 1.0 and that some groundfish are often modeled with steepness near 0.72–0.8. He said, “If you change the productivity, say you change the steepness from one assessment to the next, you should be prepared to see a different scale and or stock status.”
The presenter described reference points and the 40/10 proportional control rule used in many groundfish assessments: managers typically target 40% of unfished biomass, reduce catch more steeply below 40%, and approach zero catch near a 10% floor; for rockfish he noted the limit reference point used in council practice is 25%. He also explained how the Scientific and Statistical Committee (SSC) uses the p* (probability) approach to choose a percentile from the distribution of the overfishing limit (OFL) to set the ABC as a precautionary buffer below OFL.
To illustrate p* and uncertainty, the presenter used a hypothetical OFL median of 500 metric tons and showed that applying a p* of 0.45 with an assumed sigma of 0.5 produced an ABC near 470 metric tons. He emphasized that the width of the OFL distribution (sigma) multiplies the effect of p* — assessments with larger sigma (higher uncertainty) yield larger reductions in ABC for the same p*.
The talk covered diagnostics and uncertainty exploration methods assessors use: retrospective analyses (peeling back data to test consistency), likelihood profiles (scanning parameter values such as natural mortality), alternative model runs to bracket “high” and “low” states of nature, and sensitivity analyses where parameters are fixed to different values to measure impacts on outputs. The presenter said teams run many models to avoid understating uncertainty that can result from relying on a single reference model.
He closed by reiterating that more data are not automatically more informative: data must show contrast (trends over time, changes in mean lengths or composition) to improve inference. He offered to take questions from the council and attendees at the end of the briefing.