Get Full Government Meeting Transcripts, Videos, & Alerts Forever!
Get email alerts on the Flooding And Erosion Projections topic
No spam. Unsubscribe anytime.
Whatcom County project: floodplain to expand, models show higher tides and larger river floods ahead
Summary
At a virtual workshop, Whatcom County staff presented modeling showing larger coastal and river flood hazards through mid- and late-century, and mapped infrastructure vulnerability including roads, treatment plants and utilities.
At a virtual Whatcom County workshop, Chris Elder, senior planner with Whatcom County Public Works, said county modeling shows shoreline flooding and bluff and river erosion will affect more land and infrastructure in coming decades. "The whole goal of this effort is really to try to collect a lot of the best available science," Elder said, explaining phase 2 of the Whatcom Future Shorelines project.
County presenters said current mapping shows about 82 square miles in the county reside in today’s floodplain and that modeled scenarios driven by sea level rise and changes in precipitation could expand that footprint to more than 100 square miles in coming decades. Officials cited U.S. Geological Survey coastal modeling and University of Washington Climate Impacts Group work to set planning scenarios.
The project team said the county used USGS CoSMoS (Coastal Storm Modeling System) and other regional studies to produce compound-flood modeling that combines sea level rise and storm surge on the coast with riverine flood projections upriver. Elder said Whatcom County was among the first counties in the region to gain access to the CoSMoS dataset and that phase 1 used that model to identify assets at risk.
Whatcom County staff and consultants described the specific scenarios the county is using for planning and mapping. For Puget Sound shorelines, presenters described a near-term scenario combining about 0.8 feet of sea level rise with a 20-year coastal storm for the 2040s, and a mid-term scenario of about 3.3 feet of sea level rise with a 20-year coastal storm for later this century. For the Nooksack River, presenters said models indicate the 100‑year flood could be roughly 1.2 times larger by the 2040s and roughly 1.75 times larger by the 2080s, citing University of Washington Climate Impacts Group analyses.
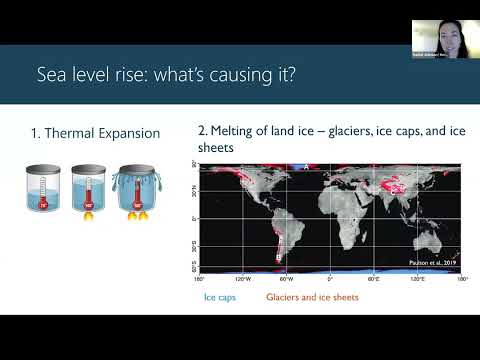
Presenters also gave examples of how coastal and riverine processes interact: higher baseline sea levels raise the starting water elevation for storms and high tides, increasing erosion at the base (toe) of bluffs and allowing wave action and surge to reach farther inland. The group cited observed changes at regional tide gauges — "sea level rise has risen 8 inches over the past a hundred years in Puget Sound" — and explained thermal expansion and land‑ice melt as drivers of future acceleration.
The modeling includes near‑term projections of nuisance high‑tide flooding: county presenters said data from Cherry Point show an average of about 1.8 days per year of high‑tide flooding over the past decade; projected median estimates were roughly 4 days per year in the 2040s and about 25 days per year in the 2080s under the scenarios used for planning.
Officials said the vulnerability assessment maps overlay infrastructure layers — roads, buildings, emergency services, wastewater and drinking‑water facilities, outfalls, and other critical assets — onto hazard areas so planners and jurisdictions can see which assets are exposed in the 2040s and in the 2080s. A color key used in presentation maps showed red for items vulnerable in the nearer term and orange for items projected vulnerable in the longer term.
Speakers emphasized uncertainty in timing and magnitude but said the direction of change is clear: more frequent and larger floods, more bluff and bank erosion, and more infrastructure exposed to hazard zones. "Sea level rise sets the baseline for flooding and erosion," a presenter said, noting that some uncertainty stems from future greenhouse gas emissions and modeling of land‑ice changes.
The county said phase 1 outputs (story map and interactive maps) are already posted on the county website, and that phase 2 updates will be posted in the coming months. Chris Elder said the phase 2 story map and final report are expected to be released in June, and listed an in‑person follow‑up workshop in Birch Bay at the North Bay Community Church for more granular, local mapping and feedback.