Get Full Government Meeting Transcripts, Videos, & Alerts Forever!
Get email alerts on the Stakeholder Survey topic
No spam. Unsubscribe anytime.
Prior Lake‑Savage Area Schools reports higher mean scores in annual stakeholder surveys; students remain highly positive
Summary
Studer Education presented the district's 2024'5 stakeholder experience survey results showing increases on 46 of 50 items, higher mean scores across students, parents/caregivers and employees, and a student Net Promoter Score of 3.71; board members pressed for disaggregated and follow-up analysis.
Studer Education presented Prior Lake‑Savage Area Schools' third annual stakeholder experience survey report, and district leaders told the school board that mean scores rose across student, parent/caregiver and employee surveys for the 2024'5 school year.
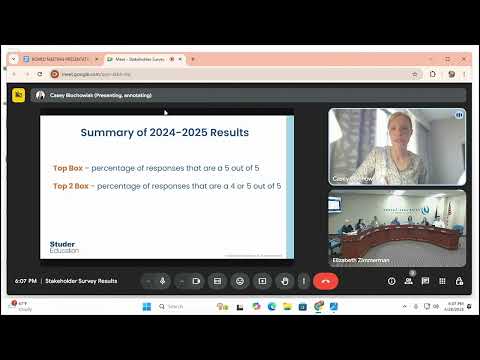
The presentation, delivered by Casey Blachowiak, vice president for leader coaching at Studer Education, showed that 46 of the 50 survey items measured increased this year; students' mean results placed them in about the 70th percentile nationally and the student Net Promoter Score (NPS) was 3.71, with roughly 32% of students giving a 9 or 10 on the 0'10 promoter scale.
The results matter because they give school and district leaders data to shape school continuous improvement plans and site-level goals, the presenters said. "We actually read every single one of these thousands of data points," Blachowiak said, explaining the district and consultant review process and how leaders use the feedback to set goals.
District administrators told the board they will provide building-level summaries to principals and leadership teams so site teams can identify what a higher score ("a 5") would look like in practice and pursue targeted actions. Dan (staff member) said the district altered its calendar for leadership review so building teams could get results to staff and begin goal-setting before summer.
Key numeric details from the presentation and board discussion: - Survey scope: three concurrent surveys for students, parents/caregivers and employees; students surveyed in grades 3'12 only (kindergarten'grade 2 are not surveyed). - Response and benchmarking: student responses placed in the 70th percentile nationally; student top-box (5/5) and top-two-box rates were cited as approximately 34% and 69% respectively. - Net Promoter Score: student NPS 3.71 (on '100 to +100 scale recalibrated from the 0'10 responses); about 32% of students reported a 9 or 10. - Item-level shifts: 46 of 50 items increased year-over-year; parents/caregivers and employees both had higher response rates than the prior year. - Parent/caregiver results: roughly 35% top-box (5/5) and about 74% top-two-box (4 or 5); the parent NPS for the district dropped slightly year over year. - Employee results: top-box share about 25%; roughly two-thirds of employee responses were in the top two boxes; employee NPS moved in a positive direction.
Board members asked for more disaggregation and local context. Director Mary (board member) requested clearer benchmarking methodology to explain why adult benchmarks rank differently than student benchmarks; Blachowiak said each respondent group has its own national benchmarking set. Director Johnson asked whether students were asked to recommend the district rather than their school; Blachowiak said she would consult the survey team and return with the methodology.
Directors also pressed administration on participation patterns: student participation dipped this year despite a similar administration method, prompting district staff to flag it for further analysis and outreach. "We're a little bit perplexed by that and will continue to analyze why students are not participating at the same rates," Blachowiak said.
Administrators described how the district will use the data locally: principals will receive raw data sets, engage parent leadership groups and building instructional teams, and use comments as context for quantitative results. District leaders said school continuous improvement plans will incorporate prioritized survey items and that fall "state of the school" reports will include those priorities for community review.
Board members were told follow-up materials will appear in school improvement plans and on the district website, and that building-level summaries would be available to the board and public. No formal board action was taken on the survey results; the presentation was an informational item.