Get Full Government Meeting Transcripts, Videos, & Alerts Forever!
Get email alerts on the Pavement Management topic
No spam. Unsubscribe anytime.
Staff shows pavement dashboard as basis for next year’s paving budget
Summary
City staff demonstrated a pavement-condition dashboard that maps streets by condition (failed, serious, very poor), lane miles and speed limits, and said it will be used to estimate costs and set priorities for the next paving contract.
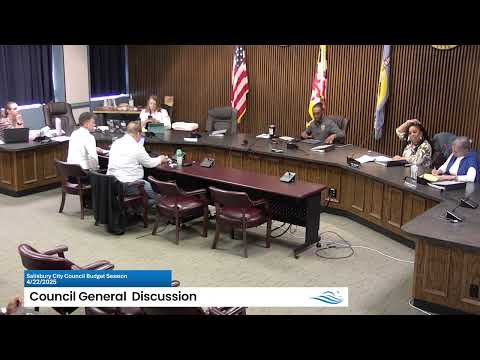
City staff presented a pavement-condition dashboard during the Salisbury City Council’s general discussion and said the tool will serve as the playbook for next year’s street-replacement and paving budget.
The dashboard shows condition categories with a legend that runs from “failed” and “serious” to “very poor.” The staff member who demonstrated the map said the darker the red, the worse the condition, and that users can toggle layers for speed limit and lane miles to extrapolate approximate costs once a price per linear foot is known.
“We can take that and then figure out what our price point is when we get our new contractor in for paving,” City staff (unnamed) said. Staff added they had emailed a link to the dashboard to council members and would share it again at the next meeting.
Staff noted they were still refining the dataset with the GIS/data analyst team and were not certain whether the dashboard was public-facing yet. The council agreed staff should drill down on the legend and prepare cost estimates so the city can build budgets from the dashboard.
The council did not take formal action during the presentation, but members asked staff to prepare numbers and an explanatory summary for the next meeting so they could use the dashboard to prioritize work and estimate bond or capital outlay needs.