Get Full Government Meeting Transcripts, Videos, & Alerts Forever!
Get email alerts on the Urban Flood Monitoring topic
No spam. Unsubscribe anytime.
FloodNet project outlines sensor network, dashboard and community tools to track street flooding in Brooklyn
Summary
A multi‑institution FloodNet team described a growing network of flood sensors and public dashboards funded by the Department of Environmental Protection that show street‑level water depth in near real time. Presenters emphasized community engagement, data products for advocacy and plans to reach 500 sensors citywide by mid‑2027.
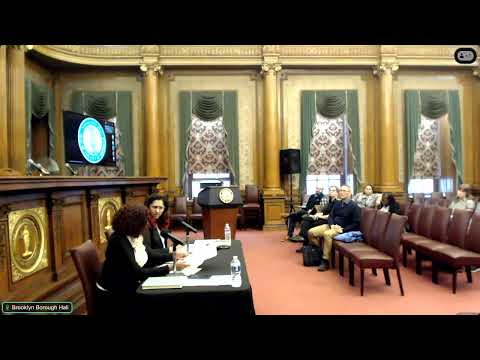
Brett Franco, director of the Science and Resilience Institute at Jamaica Bay, Brooklyn College, and FloodNet project managers told the Brooklyn Borough Board on April 1 that FloodNet operates a network of street‑level sensors and an online dashboard to measure and share urban flooding data in near real time.
“Basically what we’re doing as a team is developing tools for real time urban flood monitoring so people can access data about flooding that’s happening on their streets as it’s happening,” Franco said during the presentation. He and project manager Polly Peroni described how the network reports water depth at individual intersections and feeds an alerting and data‑download system used by both residents and city agencies.
The nut graf: FloodNet said it currently operates 265 sensors across New York City with 72 installed in Brooklyn and aims to reach 500 sensors by mid‑2027. The project said it is primarily funded by the New York City Department of Environmental Protection (DEP), shares data with New York City Emergency Management, and is developing neighborhood reports and downloadable CSV data for community use.
Franco and Peroni explained how the sensors are mounted and how they record depth. The team showed dashboard screenshots from the Sept. 29, 2023 storm remnants (Ophelia), when FloodNet measured an approximately 36‑inch reading under a sensor in Gowanus and recorded dozens of elevated readings across multiple neighborhoods. Peroni said the sensors are non‑camera distance sensors and that the network captured flood rise and fall over a period of hours during that event.
Peroni and Franco described the project’s community products: neighborhood flood reports (updated every six months), one‑page community profiles, bilingual outreach and translated educational materials, and workshops that teach residents how to read the dashboard and use the data for advocacy. Franco said FloodNet has received more than 1,000 public suggestions for sensor locations and prioritizes installations to achieve equitable distribution across boroughs.
Technical and operational details provided during the meeting included: the project has reduced per‑sensor cost to roughly $240–$250 using off‑the‑shelf components; sensors run on internal batteries recharged by solar panels; data are transmitted over cellular connections; and the team monitors device health for vandalism or mechanical issues. The presenters said sensors have been installed continuously for years in many locations and that earlier designs and documentation are publicly available on GitHub.
Residents and board members asked how FloodNet data are used to determine causes of flooding and whether data account for rainfall, tides or clogged catch basins. Peroni said FloodNet collects rainfall and tides in addition to depth readings and that those datasets are used to research causation, but that causal analysis requires additional work. A participant representing a City Council office said DEP can use the flood profile to infer clogged catch basins when drainage does not decrease.
On access and inclusion, the presenters said the dashboard and website (floodnet.nyc and datais.floodnet.nyc) are mobile accessible and that the project is working to improve WCAG and accessibility features. They also said that DEP currently funds the installation and that the core funding for deployment and data improvements is city funding, with earlier state and university support.
Community members asked about specific coverage: the presenters said there are five sensors in Coney Island, two in Brighton Beach and one in Manhattan Beach, and noted upcoming installs in Bay Ridge, Cypress Hills and parts of Bed‑Stuy and North Brooklyn. They invited community boards to request presentations and to submit sensor location suggestions via the project’s QR form and email (info@floodnet.nyc).
The presentation closed with the FloodNet team offering to share the presentation materials and to work directly with community boards on outreach and sensor siting. The FloodNet team emphasized that data are intended for residents, community organizations, researchers and city agency use rather than as a proprietary agency product.