Get Full Government Meeting Transcripts, Videos, & Alerts Forever!
Get email alerts on the Data Visualization topic
No spam. Unsubscribe anytime.
Wisconsin Arts Board committee reviews Indiana dashboard demo, plots steps to make grant data public and interactive
Summary
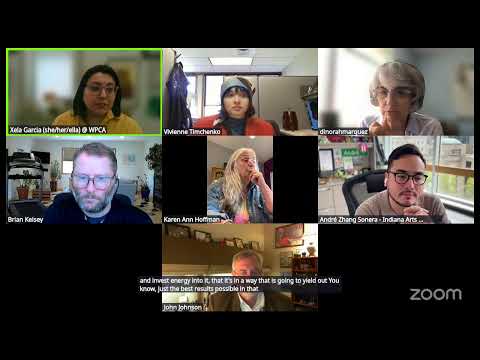
At a recent meeting of the Wisconsin Arts Board External Relations Committee, members invited Andre Zancinera, deputy director and chief of staff for the Indiana Arts Commission, to demonstrate a public-facing dashboard the Indiana agency uses to visualize grant awards by county, district and program.
At a recent meeting of the Wisconsin Arts Board External Relations Committee, members invited Andre Zancinera, deputy director and chief of staff for the Indiana Arts Commission, to demonstrate a public-facing dashboard the Indiana agency uses to visualize grant awards by county, legislative district and program.
Committee members said the tool could let staff and elected officials pull one-page summaries for a county, congressional district or legislator while meetings are underway. "It's a good opportunity to bring a tablet with you and have a conversation with the legislature and have them the opportunity to just go and see what is happening in their district," Zancinera said during the presentation.
The dashboard shown uses Power BI to read grant-report fields (organization name, county, congressional and state legislative district, program type, award amount and discipline codes) that the agency already collects through grantee final reports and the national reporting standards. Zancinera described the Indiana system as updated monthly when a grant contract is executed; he said Indiana maintains approximately 5,342 grant records in the dashboard and issues roughly 300 to 600 grants a year.
Committee members and staff focused discussion on three practical topics: (1) whether Wisconsin has the in-house IT capacity and permitted software to embed a live dashboard on its website; (2) how to standardize and clean grant-report fields so a visualization will be accurate; and (3) privacy and data-sharing limits for individual artists whose addresses could be personal information.
Zancinera emphasized standardizing questions across programs so grants staff receive consistent fields and said mapping and district updates are handled by working with the state's GIS office. He also described a common operational challenge: state budget offices sometimes require agencies to use a state-prescribed grant-management system (Indiana cited a possible move to eCivis) that can complicate automated exports. Indiana has been moving results into Tableau via a state measurement/performance hub when possible, but Zancinera described the current process as partly manual: "I pull a report from Foundant...and then I'm able to post it over there. And you see right now I have 5,342 lines of grants right now at the moment. Right. But that is manual labor." (Andre Zancinera, Indiana Arts Commission).
Committee chair Brian Kelsey and several board members said they hoped a dashboard would allow staff to present up-to-date, regional one-page summaries to legislators and mayors during site visits rather than wait for biannual reports. Vivian (Department of Public Instruction) said she will raise the question with state IT and data offices to determine what in-house tools and hosting options Wisconsin has available.
Board members and staff discussed an implementation timeline of roughly six to nine months if the board proceeds, with most cost described as staff time. Zancinera said the Indiana agency maintains the visualization on a Microsoft Power BI license that the agency pays about $45 per month for; he described staff time — including a grants and research manager, program staff and interns — as the principal investment.
The committee asked staff to take two immediate steps: (1) confirm what grant-report fields Wisconsin already collects and whether they are standardized across programs, and (2) open a conversation with the state Department of Administration and the state's geospatial/GIS office about hosting, mapping shape files and permissible public data fields. Vivian said she will follow up with the DOA and report back to the committee.
Members agreed to continue the discussion at the committee's next meeting and to explore connecting existing spreadsheets to a dashboard solution rather than building a custom mapping product from scratch.