Get Full Government Meeting Transcripts, Videos, & Alerts Forever!
Get email alerts on the Student Assessment And Readiness topic
No spam. Unsubscribe anytime.
Rochester administrators describe K–12 assessment practices, PSAT/SAT prep; trustees ask for clearer i-Ready and cohort data
Summary
District leaders detailed multi-tiered systems of support, grade-level team meetings and a multi-year PSAT/SAT readiness timeline; trustees asked for clearer trend and item-level data for i-Ready and flagged areas of concern in eighth- and eleventh-grade results.
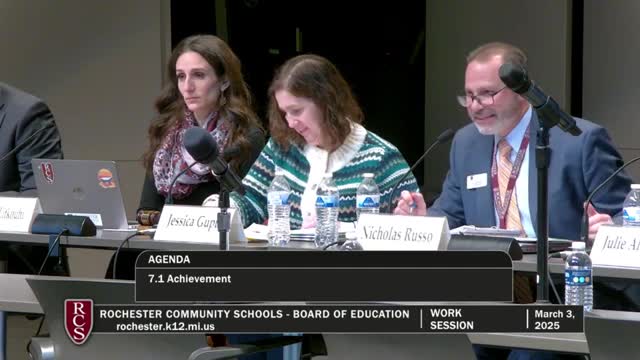
Rochester Community Schools administrators used a Feb. work session to outline district practices for classroom assessment, multi-tiered systems of support (MTSS) and a K–12 timeline for PSAT/SAT readiness. The presentation was informational and generated questions from trustees about i-Ready reporting, cohort trends and item-level analysis.
The presentation, led by district instructional leaders and building principals, emphasized collaborative grade-level meetings, iterative progress monitoring and a “diamond model” MTSS that provides both intervention and extension. “It’s not one singular data point that leads us in any direction,” said a principal summarizing elementary practices, noting that teams triangulate I Ready results with classroom assessments and formative work.
Middle- and high-school principals described a multi-year approach to college- and career-readiness assessments. Administrators said students are introduced to digital testing tools and PSAT formats in middle school, use College Board score reports for targeted practice in ninth and tenth grades, and receive expanded SAT/PSAT preparation as juniors. District staff cited integrated resources — including College Board practice materials, Khan Academy, Desmos and district testing modules — plus options for targeted summer instruction and school-run SAT prep.
Trustees asked for clearer data reporting. One trustee said the packet’s charts (drawn from I Ready and College Board reports) were unclear and requested cohort and domain-level trend data; another asked whether the district can disaggregate growth for lower- and higher-performing students rather than reporting median growth alone. Administrators said I Ready provides student-level domain reports and that buildings use multiple measures; they offered to follow up with math and curriculum coaches to explain an observed drop at eighth grade on math measures.
Administrators also reviewed College Board-derived indicators for the current eleventh-grade cohort. The presentation slide for combined evidence-based reading, writing and math for the fall cohort reported roughly 53% “ready” and 47% “not ready” (district slide; administrators said buildings track named students for targeted intervention). District leaders urged trustees that the ongoing work is grounded in classroom instruction, not only test prep, and said the intent is to reduce student anxiety through long-term exposure to test formats and targeted skill development.
Next steps: Administrators agreed to provide additional trend analysis and item-level context requested by trustees, and suggested that data questions be submitted in advance to allow deeper discussion. The board asked the administration to include more comparative trend data in future packets so trustees and the public can better evaluate year-over-year changes and subgroup performance.
Context: The presentation emphasized that assessments measure different things — I Ready for benchmarked, adaptive reading/math data; M-STEP as the state assessment; and PSAT/SAT as College Board measures tied to college and career readiness. District staff said they are monitoring short-term results (spring testing) and longer-term trends (cohorts as students move from middle to high school). The presentation was informational; no board action was taken on the material.