Get Full Government Meeting Transcripts, Videos, & Alerts Forever!
Get email alerts on the Enrollment topic
No spam. Unsubscribe anytime.
Albert Lea district projects enrollment decline, warns of budget pressure
Summary
District staff reported a projected end-of-year adjusted daily membership (ADM) of 3,098 and declining kindergarten cohorts tied to lower county birth rates, prompting calls for a deeper review of open enrollment, special education costs and budgeting timelines.
At a recent Albert Lea Public School District study session, district staff presented a detailed enrollment update showing a projected fiscal‑year end adjusted daily membership (ADM) of 3,098 and continued declines in incoming kindergarten cohorts tied to falling Freeborn County birth rates.
The presentation, led by Paul Durban, emphasized why the ADM projection matters: state and federal funding formulas use ADM — often adjusted by an adjusted pupil unit (APU) multiplier of 1.2 for secondary grades — so fewer students, especially at higher APU rates, reduce revenue. Durban warned that declining kindergarten classes and larger graduating classes will compound revenue losses and could strain the district’s fund balance unless the board and staff plan reductions and use restricted funds deliberately.
Durban said the district’s October 1 MARS (Minnesota Automated Reporting Student System) submission is the primary official head count used for federal revenue and E‑rate and is the best early indicator for end‑of‑year ADM. He reported a current seat count of 3,235 (an increase of 27 students from the previous year) but noted seat counts should not be used directly to estimate funding because ADM accounts for how long students are enrolled. “I like to say ‘butts in seats,’” Durban said, acknowledging the informal phrase while distinguishing seat count from ADM.
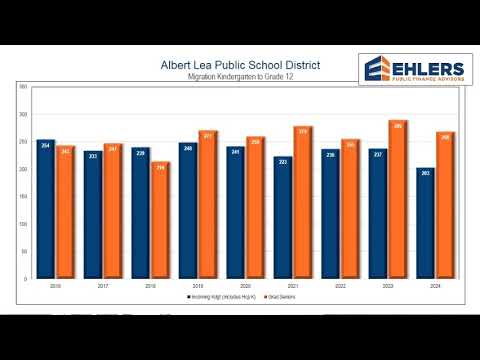
The district’s financial advisers (Ehlers) and Durham’s team used a six‑year, grade‑level attrition model and migration data to arrive at a projected end‑of‑year ADM of 3,098; the same model produced identical results when run independently by the district’s advisors, Durban said. He also described a larger trend: kindergarten cohorts are shrinking and, because seniors are counted at a 1.2 APU while kindergarteners are counted at 1.0, losing large graduating classes while gaining smaller kindergarten classes creates a compounding budget effect.
Durban reviewed migration patterns and causes: over the last five years the district averaged a roughly 4.8% drop from kindergarten to first grade in year‑to‑year migration; incoming sixth grade showed gains partly attributable to non‑public programming phasing out; and the district saw losses in 11th grade, where about 30% of the outflows were transfers, 40% family relocations and roughly 10% 15‑day drops or other causes. Durban said the raw counts for some of these patterns are small (for example, the 11th‑grade net outflow was about 10 students) and merit case‑level review.
The district also reported demographic shifts. Using a 2014–2024 comparison Durham highlighted increases in the English‑learner population (from about 7.9% in 2014 to 11.6% in 2024, or roughly 386 students), free and reduced‑price meal eligibility (from roughly 50.9% to 60.9%, about 2,034 students), and an increase in students identified as homeless (from 4 to 29). Durham said improved identification practices by social workers may account for some of the rise in homelessness counts. Special education enrollment rose slightly in head count (from about 662 to 698) although staff noted the intensity and cost of services can change even when head counts are stable.
Durban pointed to county birth rates as a leading predictor of kindergarten enrollment, explaining that historically Freeborn County births translate into roughly 100 fewer students enrolled in Albert Lea kindergarten in the corresponding cohort year. Using that correlation, the district’s model projected kindergarten ADM around 209 for the current cohort and lower numbers in the next several years, a pattern that would contribute to falling elementary enrollment and fewer classroom sections in the district’s four elementary schools.
Durban described strategies the district has begun or will begin to pursue: a mailer to families who open‑enrolled out that will include a brief survey to learn reasons families left; a planned updated demographic and housing study every four years (next due in 2027) as recommended by demographer Hazel Reinhardt; and closer review of how restricted (compensatory) funds and general fund balances are used to meet increases in English‑learner and special education costs.
Durban also relayed community economic development context from Philip Johnson, executive director of the Albert Lea Economic Development Agency (ALITA), who told district staff that housing is a top community priority and that ALITA seeks to add roughly 500 new housing units over five years to help drive population growth that could, in time, increase school enrollment.
Board members asked for additional, itemized data. One board member requested a breakdown showing which neighboring districts Albert Lea students open‑enroll to and which external districts enroll incoming students. Durban said he has the Mars data and will prepare a report that removes personally identifying information and can present it to the board. He and other staff agreed to return with additional updates in March: a revised budget presentation is scheduled for March 3, and the board will receive final‑budget information after state revenue projections in May and a final budget adoption planned for the June 16 board meeting.
Durban and board members emphasized that the projections are estimates, not firm outcomes. “These are forecasts,” Durban said. “They’re just a tool” to help the board plan staffing, building occupancy and budgets. The presentation closed with the district committing to continued monitoring of migration patterns, targeted outreach to families, and regular updates to the board.
Questions and follow‑up items raised at the study session included a request for: - an open‑enrollment destination breakdown (which Durban agreed to provide); - a March update on special education needs and cost pressures; and - the March 3 revised budget presentation and the June 16 final budget adoption schedule.
The board did not take any formal policy action on enrollment at the meeting; staff received direction to return with the requested data and to include the information in the March budget update.