Get Full Government Meeting Transcripts, Videos, & Alerts Forever!
Get email alerts on the Public Safety Data topic
No spam. Unsubscribe anytime.
Oregon Criminal Justice Commission details statewide public‑safety data trends, dashboards and forecasts
Summary
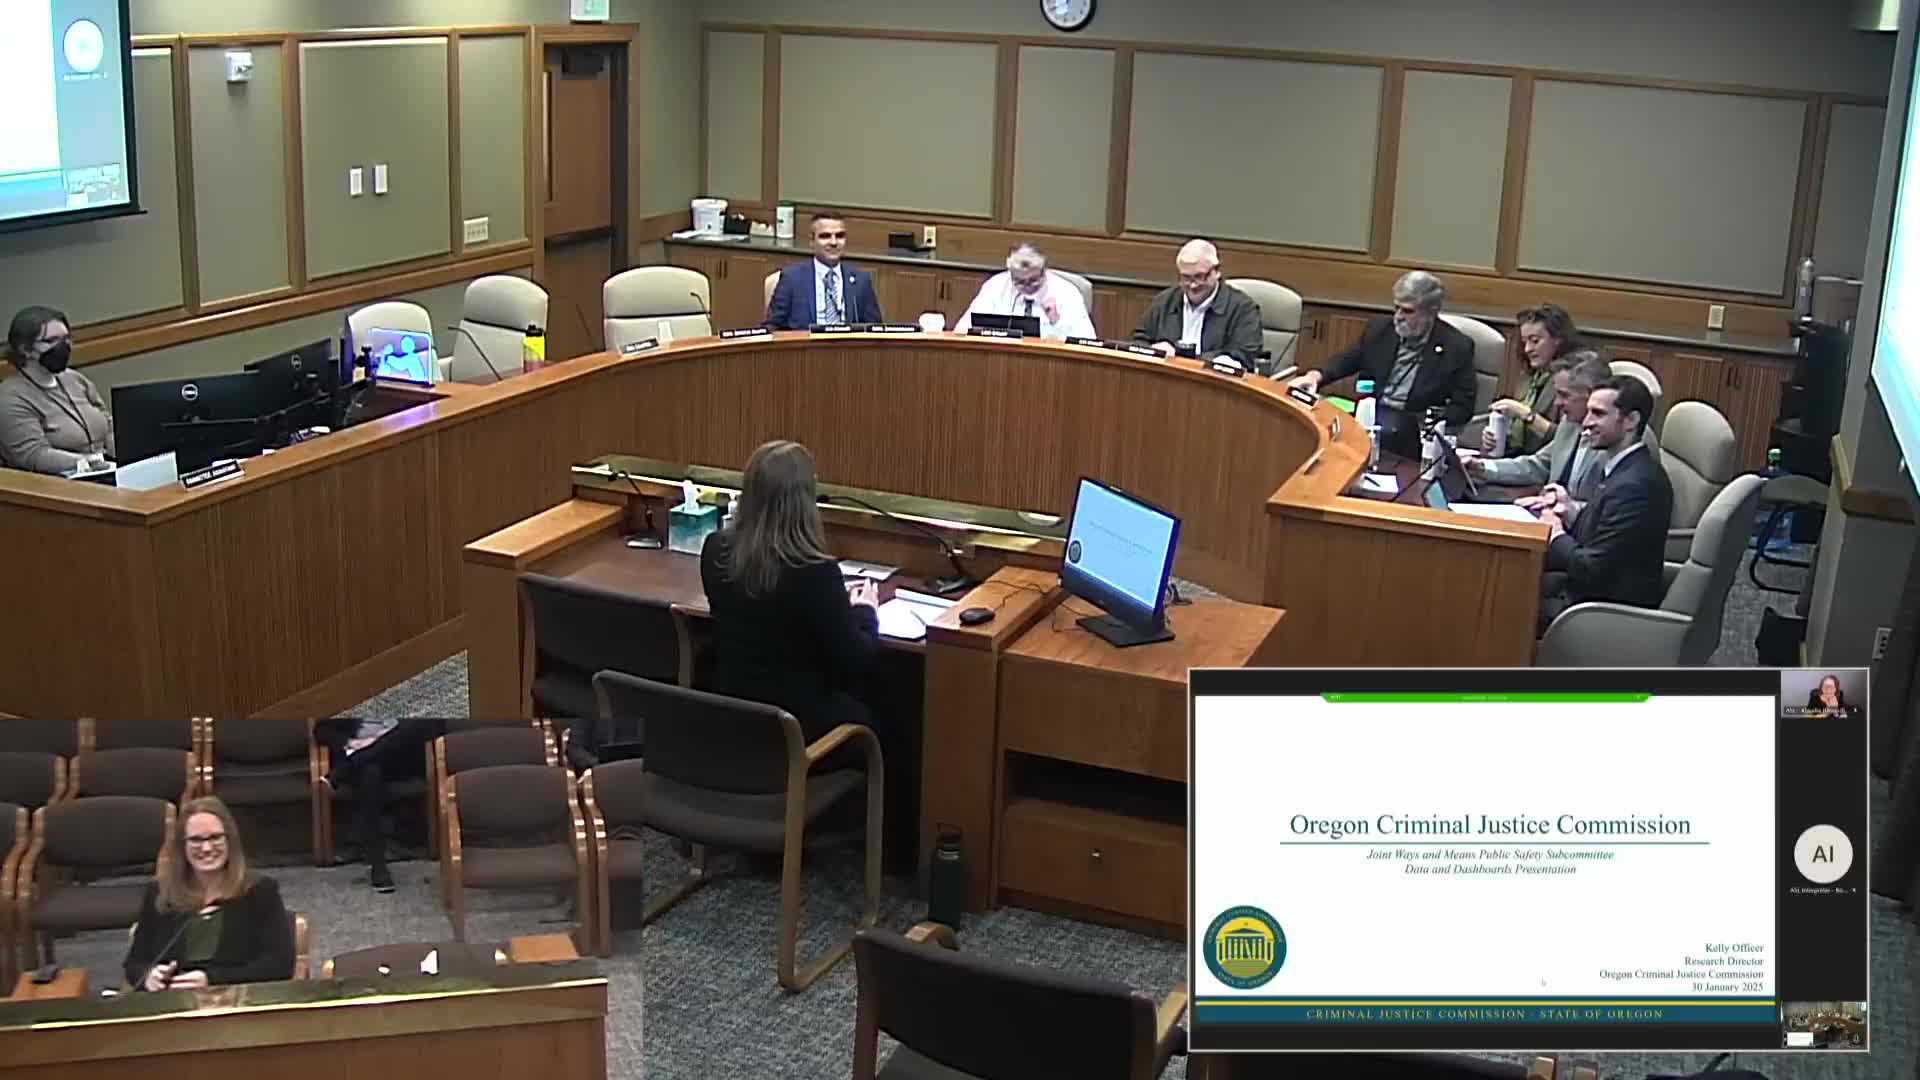
Salient state public‑safety data and public dashboards were the focus of an informational hearing of the Public Safety Subcommittee of the Joint Committee on Ways and Means on Jan. 30.
Salient state public‑safety data and public dashboards were the focus of an informational hearing of the Public Safety Subcommittee of the Joint Committee on Ways and Means on Jan. 30. Kelly Officer, research director at the Oregon Criminal Justice Commission (CJC), summarized traffic‑stop records, reported crime, arrest trends for drug possession and 10‑year prison population forecasts, and described the agency’s public dashboards and update schedules.
The CJC presentation emphasized that officer‑initiated traffic stops fell sharply in spring 2020 and have risen since late 2021, while the share of stops for vehicle lighting violations fell after Senate Bill 1510 took effect. “We now have about six years of data for the largest law enforcement agencies across the state,” Kelly Officer said, adding the data include traffic stops, circuit court filings, Department of Corrections supervision records and grantee‑reported program information.
Why it matters: members said they rely on consistent, statewide sources to make policy decisions and to understand whether changes such as statute updates or pandemic effects changed either reporting or underlying public safety conditions. Officer repeatedly cautioned about data lags (the FBI UCR/NIBRS statewide data in the presentation extended through 2023) and explained where state dashboards provide more frequent updates.
Traffic stops and lighting violations: Officer showed CJC traffic‑stop dashboards broken out by agency size (tier 1: 100+ officers; tier 2: 25–99; tier 3: 24 or fewer). Monthly stop volumes plunged in March–April 2020 (COVID) and fell again during later COVID waves; for tier‑1 agencies the initial drop was about 42 percent. Since late 2021 stop volumes have generally increased, with seasonal peaks in late spring and summer. Officer also showed that the percentage of stops recorded as for lighting violations fell after Senate Bill 1510, which changed how officers may initiate stops for lighting violations; the law passed March 2022 and became effective Jan. 1, 2023. The statewide peak for lighting‑related stops was roughly 11% in December 2021 and later peaked near 4.1% in December 2023 after the change.
Search rates: CJC data indicate discretionary search rates declined over time and fell further after the consent‑search changes in Senate Bill 1510. Tier‑1 discretionary search rates dropped from about 2.8–3.0% to approximately 1.5%; tier‑2 and tier‑3 agencies show similar declines (tier‑2 to ~1.1%, tier‑3 to ~0.5%). Officer noted NIBRS excludes mandatory searches from those figures and that the stop record captures the officer’s stated reason for the stop.
Reported crime and arrest trends: The presentation compared long‑term UCR violent and property index trends for Oregon against national rates, showing the mid‑1990s peak and long decline since then, with a local 2021 bump. For large Oregon cities (Portland, Eugene, Gresham, Hillsboro and Salem) six‑month UCR updates through June 2024 show a sharp drop early in COVID, a spike that peaked in late 2021, and a subsidence toward earlier levels thereafter. Officer stressed the UCR/NIBRS series measures incidents known to law enforcement (reported or discovered) and therefore undercounts crimes that are not reported.
Drug possession and Measure 110 effects: CJC’s weekly arrest dashboard (updated typically by Wednesday) shows arrests that include a drug possession charge. Pre‑COVID weekly totals ran near 300; they fell during COVID, rose after Measure 110 (law change effective Sept. 1) and then moderated. Officer cautioned that arrest records do not reliably indicate whether a possession charge reflects a “user amount” versus larger amounts; case‑filing data from Odyssey provide that level of detail.
Prison population and forecast: CJC presented long‑term prison population dashboards and a 10‑year forecast produced with the Office of Economic Analysis. As of Jan. 1, 2025, Officer reported the male prison population at about 12,100 (below prior peaks) and the female population at about 1,030; the dashboards show facility openings/closings, current full‑capacity lines (which reflect two prison closures since 2019) and the teal forecast line for the next decade. Officer said the forecast incorporates admissions, projected release dates and mortality assumptions and is updated twice a year.
Justice reinvestment and sentencing changes: The presentation placed major sentencing law changes on the prison‑population timeline (Measure 11 in 1995, Measure 57 in 2008, justice reinvestment in 2013 and the 2020–21 COVID period and related policy actions). Officer said justice reinvestment and county‑level programs aimed at property and drug‑eligible cohorts helped avoid projected prison growth that otherwise would have required additional capacity in the mid‑2010s.
Dashboards, data sources and access: Officer described CJC dashboards as public, county‑filterable and updated at different cadences (some weekly, some monthly, some semiannually). The agency receives traffic stop data from law enforcement; circuit court data from the Oregon Judicial Department via Odyssey; arrest fingerprint data from Oregon State Police; specialty‑court data from OJD; and grantee‑reported program data. Officer said CJC can collaborate with counties that want custom dashboards and provides technical assistance for grant‑administered programs CJC funds.
Meeting context and limitations: Committee members asked about gaps (for example, whether 911 reports that do not get an officer response still enter NIBRS) and the CJC reply was that incidents known to law enforcement—via 911, online reporting or a CAD dispatch entry—should be recorded into NIBRS even if an officer does not physically respond. Officer repeatedly cautioned about data lag (UCR statewide data through 2023) and about limits in linking different sources without additional data‑sharing (for example, matching crash records from ODOT to traffic‑stop files).
The hearing closed with members asking for follow‑up data requests and a reminder that CJC director Ken Santagran will present a more detailed CJC budget and deflection update to the committee in a forthcoming meeting.