City launches public permits and development dashboards to show active projects
Get AI-powered insights, summaries, and transcripts
Sign Up Free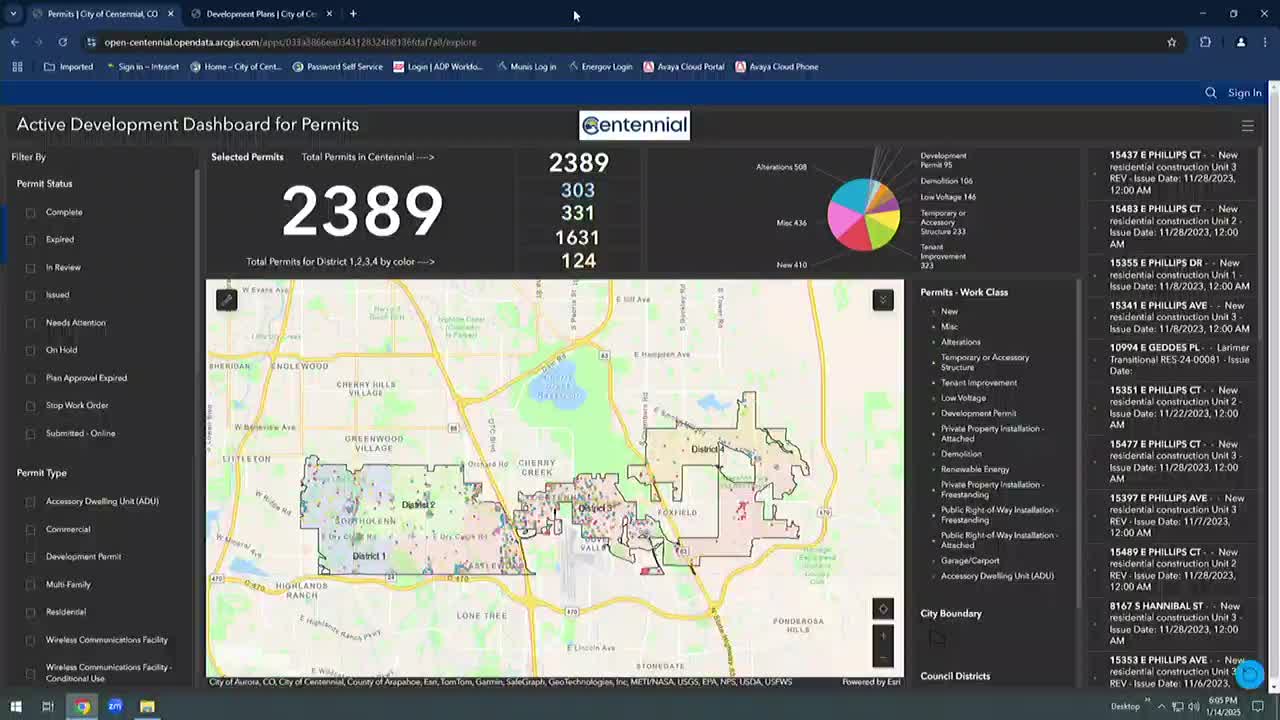
Summary
City staff demonstrated new public-facing GIS dashboards that show active permits and development plans for Centennial; the tools are browser-based, updated daily, and intentionally omit direct links for sensitive locations. Staff will monitor usage and collect feedback before expanding shown permit types.
Centennial staff demonstrated a new, publicly accessible set of interactive dashboards that let residents and council members view active development permits and planning applications across the city.
The dashboards, staff said, are available without a login from the city’s Maps & Open Data web page and “are updated automatically, daily,” giving users the ability to search by address, filter by permit status, work class or council district, and access application details and attachments where available. “These interactive tools are designed to provide real time information on ongoing development projects and permit activities throughout Centennial,” Michael Sandoz, senior GIS analyst, told the council during a live demo.
City staff framed the dashboards as an early-transparency tool intended to let neighbors see proposals and permit progress before projects reach public hearing stages. “This is a tool to increase that transparency and show the progress of permits and plans from beginning to end,” Sandoz said. Mike Jones, the city’s Technical Services Manager, described the effort as an investment in both technology and people to integrate the city’s systems and make permit data easier to find.
How it works and what’s included - The web application centralizes permit records tied to addresses and shows an interactive map and a right-hand list of matching permit records. The system currently shows 2,389 permits when filtered to “active development” (staff cited that number during the demo) and breaks counts down by council district (District 1: 303; District 2: 331; other district totals shown on the dashboard). - Users can click a map dot or a list item to open a permit record with basic fields (application date, issue date, expiration date, work class, status, short description) and a link into the city’s permitting system (EPL) to view attachments, stamped plans, and inspection history where available. - Filters include permit status (for example, “in review” or “need attention”), work class (tenant improvement, demolition, low voltage, etc.), council district and date ranges (application, issue or expiration dates). Staff demonstrated zoom- and map-view-based filtering that reduces the results to what is visible in the current map window.
Data scope, privacy and limitations City staff emphasized the dashboards are focused on development permits that require plan review; one-stop/over-the-counter permits are largely excluded to avoid doubling the visible count. Staff also said not all addresses show direct links: “For locations that might be considered more sensitive — residential addresses, schools, or the jail — we are not showing those links out of safety and privacy concerns,” Sandoz said. The dashboard will still list a permit record for some of those sites but omits direct links to attachments where the city determined it is appropriate.
Accessibility and devices Staff said the dashboards are browser-based (no separate app required) and are optimized for mobile phones; on phone views the interactive pie chart and full list may not display but core functionality and data remain accessible. Staff acknowledged there is not yet a tablet-optimized view and committed to follow up on tablet layout and navigation concerns raised by councilmembers.
Next steps and staff direction City staff said they will monitor map usage, collect public feedback through the city’s communications channels and refine the interface. Council asked for help materials: several members requested a short how‑to video or a simple tutorial and outreach to share the tool with constituents and at district meetings. Staff said they will pursue follow-ups on: tablet optimization, adding help/tutorial content, outreach to district meetings, and evaluating whether to expand the set of permit types shown in the future.
Why it matters Council members said the dashboard will help them respond to constituent inquiries and make inspection/permit status visible to residents who see construction and ask what is being built. Staff framed the tool as a transparency measure that brings the city’s internal permit view into the public sphere and should reduce phone calls and delay in answering simple questions about active projects.
What the demo did not change There were no formal actions or policy changes during the presentation. Staff said the dashboards are a data and outreach product — they do not alter permit processes, review standards, or hearing requirements.