Get Full Government Meeting Transcripts, Videos, & Alerts Forever!
Get email alerts on the Student Performance Metrics topic
No spam. Unsubscribe anytime.
District posts gains on California School Dashboard; English‑learner progress and attendance improved
Summary
Assistant Superintendent Haley presented the district's 2024 California School Dashboard results: ELA and math in the green band, science listed as information only and below standard, English‑learner progress moved from red to green with nearly 13 percentage points of improvement, and chronic absenteeism declined to 8.5%.
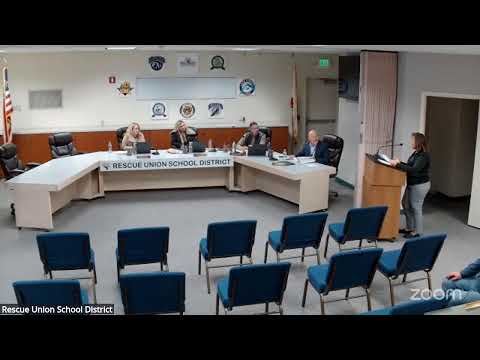
Assistant Superintendent Haley presented the Rescue Union School District's 2024 California School Dashboard results and discussed next steps for areas of focus.
Haley summarized the dashboard indicators and said English language arts and mathematics performance appear in the green band for the district. "We're definitely happy with where our students are performing," Haley said, while adding there is ongoing work to continue improvement toward the highest (blue) band.
Science appears on the dashboard this year as an information‑only indicator; Haley said the assessment is lengthy and the state is still developing power‑standard guidance, so local teachers and leaders are learning how best to interpret results. She said the district is working to establish standards of emphasis so teachers know where to concentrate instruction.
Haley highlighted a substantial improvement in English‑learner progress after district efforts to clean up data and adjust services. "The proof is right there that we went from red to green," she said, noting roughly a 13 percentage‑point increase following corrections to student classifications and strengthened intervention services.
Chronic absenteeism has declined since the COVID period, Haley said. The district moved from 19.9% to 11.1% and then to 8.5% this year; she described local attendance‑review teams that meet with families and a monthly administrator report process to monitor trends. "We're getting the kids to school," Haley said, while noting pre‑COVID rates were about 4.5% and more work remains.
On suspension rates, Haley said the district's absolute suspension percentage remains low (around 1.5–1.6%), but the state's color‑coding placed the district outside the top band. She emphasized administrators use restorative practices and that suspensions remain a last resort for safety reasons.
Haley closed with next steps: continue supporting English learners, sustain attendance efforts with early interventions, learn from the new science data and target supports for student groups such as students with disabilities and economically disadvantaged students.
Ending: The dashboard report was informational; Haley recommended continued focus on EL progress, chronic absenteeism and interpreting the new science indicator to set targeted classroom priorities.