Get Full Government Meeting Transcripts, Videos, & Alerts Forever!
Get email alerts on the Education Finance topic
No spam. Unsubscribe anytime.
Committee hears overview of Minnesota school funding formulas, wide district disparities and special-education cost pressures
Summary
Nonpartisan staff reviewed how state, local and federal revenues and equalization work in Minnesota school finance, highlighting large variation among districts and a persistent special-education "cross subsidy" that draws on general funds.
Members of the Senate Education Finance Committee heard a nonpartisan briefing on school funding formulas and district revenue variation, and discussed how special-education costs are straining local general funds.
"Do a brief overview of the funding formulas. We get a lot of bills and discussions here in this committee," said Senator Rehrig, opening the request for the briefing and asking staff to clarify why district revenues vary. The committee invited nonpartisan staff to present an updated, district-level view of revenue sources and trends.
The presentation by Bjorn Arneson, a member of the nonpartisan Senate Council Research and Fiscal Analysis staff, summarized how district revenues are composed of federal aid, state aid and local property-tax receipts; how two different tax bases (referendum market value and net tax capacity, including adjusted net tax capacity or ANTC) are used across programs; and how equalization aid changes the share paid by the state versus local taxpayers. "My name is Bjorn Arneson. I'm a member of the nonpartisan, senate council research and fiscal analysis staff," Arneson told the committee before reviewing the data.
Why it matters: Arneson said the distribution of revenue matters because it affects both the total money available to districts and the tax effort required of local property owners. He showed statewide shares for fiscal 2025 in which roughly two-thirds of district revenues came from state sources, about one-quarter from local sources and roughly 8% from federal sources. Arneson advised members that some long-running legislative changes (including a major 2003 shift that moved a statewide property levy into state aid) have changed the mix of state and local funding.
Key findings and figures presented - General education composition: Arneson showed that, on average, the formula allowance (basic revenue) accounted for about 68% of general education revenue in fiscal 2025; compensatory aids about 8%; referendum revenues about 10%; and the board-approved local optional program about 7%. - Trend lines: Combined general fund revenue per pupil rose nearly 118% in nominal terms between 2003 and 2025; adjusted for inflation using the CPI, that increase was about 25% over the same period. State general-fund aid per pupil rose roughly 83% nominally and about 5.5% in inflation‑adjusted terms, Arneson said. - Tax-base variation: Arneson pointed to wide variation in property-wealth measures: for several tax-base metrics the 75th-percentile district had roughly twice the per-pupil tax base of the 25th-percentile district. He said those differences help explain variation in local tax rates and in how much districts rely on state equalization aid.
Equalization and "off the formula" districts Arneson described equalized levies and the concept of districts being "off the formula" — meaning a district's property wealth per pupil is high enough that, under a given equalization formula, it raises the revenue in that program fully from its local levy and receives little or no equalization aid. Committee members asked whether more districts could drift "off the formula" over time; Arneson said that is likely if statutory equalizing factors are not adjusted while property values change.
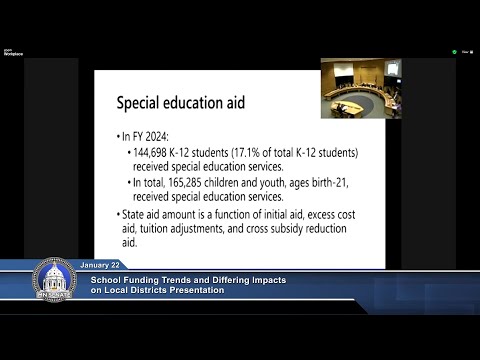
Special education cross subsidy A significant portion of committee discussion focused on special education. Arneson reviewed the state data showing more than 165,000 children (birth to 21) received special-education services in fiscal 2024. He summarized the concept the committee commonly hears as the special-education "cross subsidy" — the portion of special-education expenditures that categorical revenues do not cover and that districts must pay from other general fund resources.
Arneson described recent legislative changes aimed at reducing that cross subsidy: a program first enacted in 2019 and increased by the 2023 legislature reduces the net cross subsidy by 44% in the current year and is scheduled to lower it to about 50% beginning in fiscal 2027. He noted the state average cross-subsidy per adjusted pupil unit was $842 in the report covering fiscal 2023 and that the amount varies significantly by district group (for example, Minneapolis and St. Paul averages were higher than many greater‑Minnesota districts in the dataset cited).
Committee members pressed for explanations of the metro/greater-Minnesota differences. Senators pointed to several possible causes discussed in the briefing and during Q&A: larger metro districts may enroll more students whose needs are costlier or use higher‑cost placement options (for example, intensive private or regional placements or level‑5 facilities); charter-school billing practices and how costs are allocated between resident districts and charter schools; and local decisions about levies and referendum revenue that change the overall mix of funds.
"We did pass legislation with the commitment to cover 50% of that cross subsidy by 2027," said Senator Kunish, noting the policy intent behind recent funding changes and urging continued work on cost drivers and upstream interventions.
Grants and reporting MDE staff were represented in discussion and a separate packet included two spreadsheets summarizing grant appropriations that fall under the committee's jurisdiction: one for educational entities (districts, charter schools, cooperatives and higher-education recipients) and one for nonprofit recipients. Ms. Hoefer (referenced as a presenter in earlier sessions) described the documents and summarized how grant agreements and reimbursements typically work. She also flagged Minnesota Statutes section 127A.20 (the evidence-based grants statute) as applying to grants awarded on or after July 1, 2022, requiring goals, strategies and data plans and reports within 180 days after the grant period ends.
Follow-up and next steps Committee chairs and members requested additional materials and follow-up data: Arneson said he would provide more detailed district-by-district information on which districts are "off the formula," and to locate additional breakdowns (committee members specifically asked for an English-learner cross-subsidy chart and other program-level reports). The committee also planned upcoming hearings: a follow-up on attendance and a superintendent roundtable to hear how statutory and policy requirements affect district budgets.
The briefing underscored the committee's recurring themes: the complexity of Minnesota's K‑12 finance code, substantial variation across districts in tax base and revenue per pupil, and the continued strain on general funds from special-education costs. Several senators asked the committee to pursue deeper analysis of policy options, including adjustments to equalization factors, simplifying categorical constraints, and examining upstream interventions to moderate special-education costs.
Ending note: Committee staff and MDE were asked to circulate the detailed spreadsheets and specific charts cited during the briefing; members said they planned further informational hearings and invited school leaders and districts to testify in coming sessions.