Get Full Government Meeting Transcripts, Videos, & Alerts Forever!
Get email alerts on the Higher Education Funding Enrollment topic
No spam. Unsubscribe anytime.
House staff briefing highlights post‑pandemic enrollment declines and tangled tuition, aid and funding links
Summary
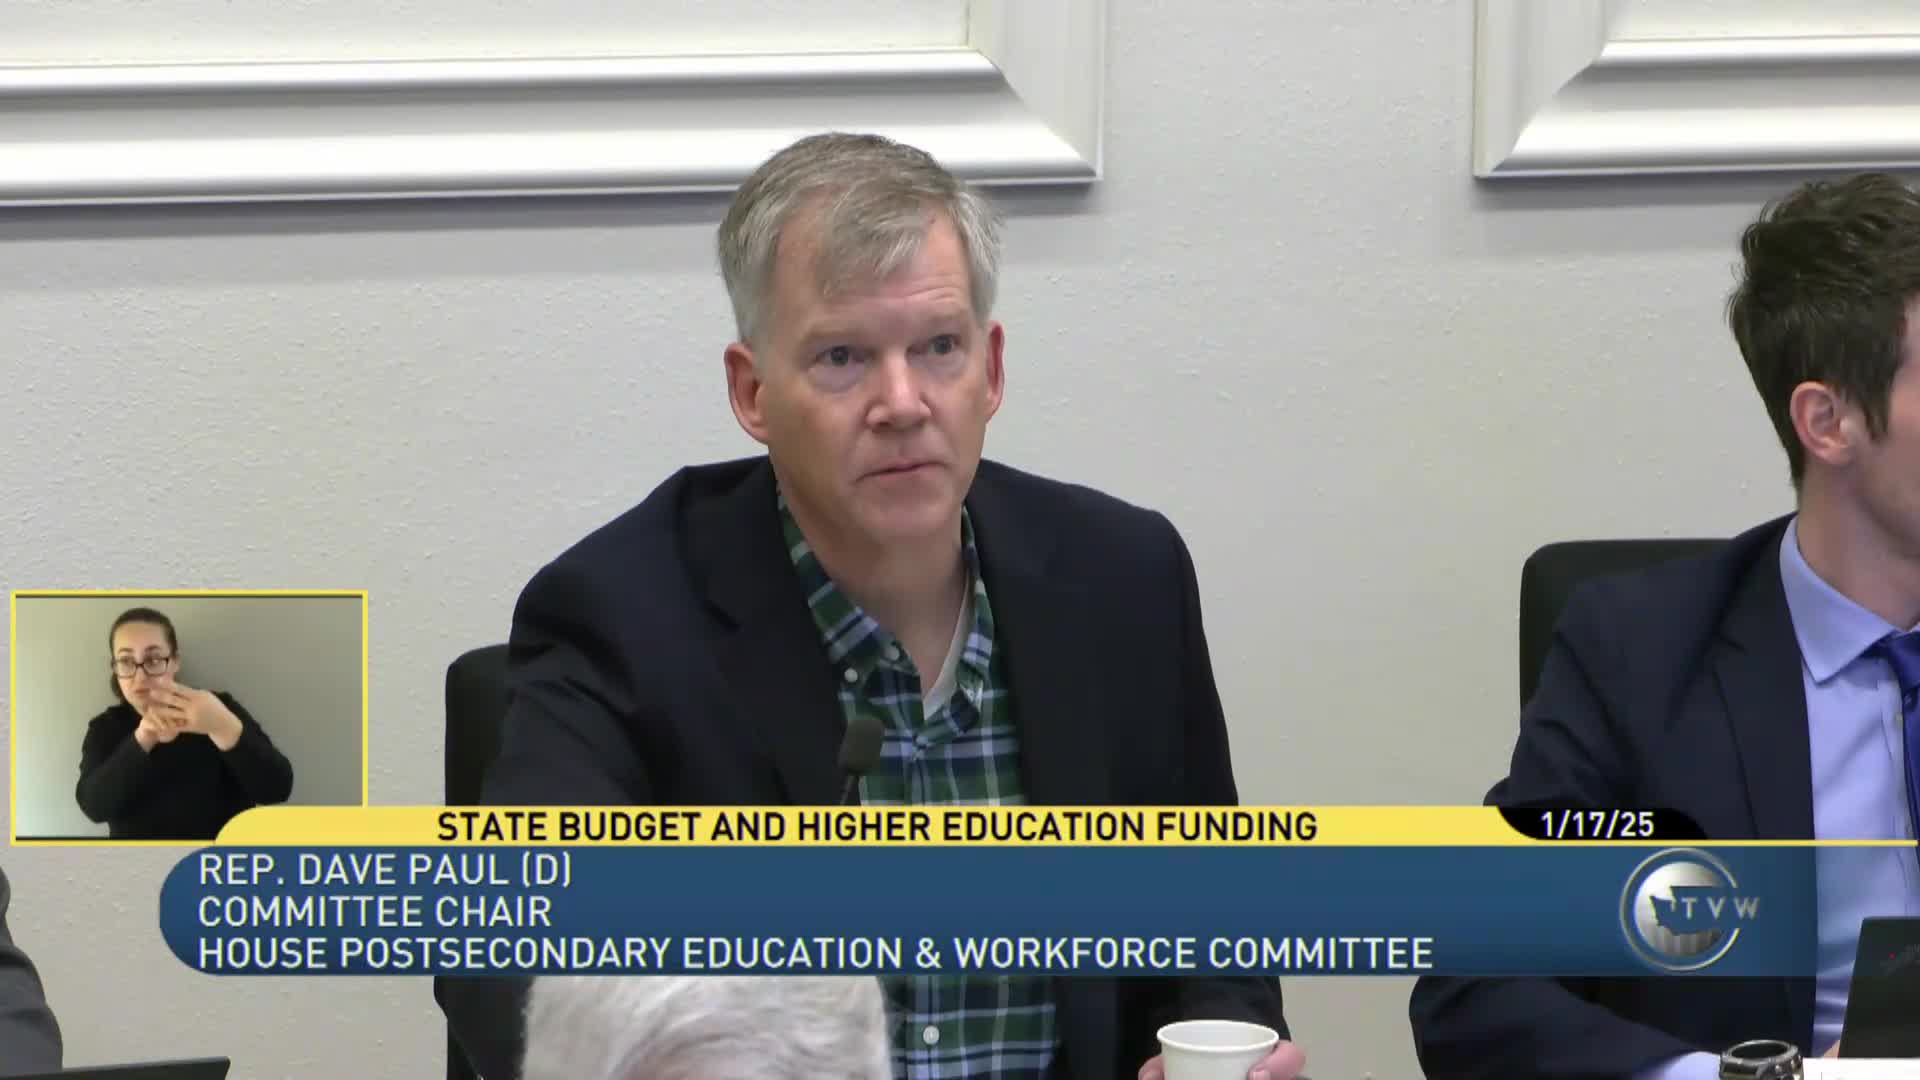
House Appropriations staff briefed the House Postsecondary Education & Workforce Committee on enrollment trends, tuition history, and the state’s financial‑aid and funding structure for higher education in Washington.
House Appropriations staff presented a work‑session briefing to the House Postsecondary Education & Workforce Committee covering Washington’s higher‑education institutions, enrollment trends, tuition authority, state financial‑aid programs and funding sources.
Kate Henry, staff to the House Appropriations Committee, told members there are two research universities (University of Washington and Washington State University), four comprehensive/regional public universities (Eastern, Central, Evergreen and Western), 34 community and technical colleges (CTCs) and more than 200 registered apprenticeship programs across the state. Henry said the public four‑year institutions together serve about 100,000 full‑time equivalent (FTE) students in the current academic year; the CTC system serves roughly 102,000 FTEs and about 151,000 headcount, reflecting a larger share of part‑time and short‑term enrollments.
Henry walked the committee through enrollment history: the CTCs experienced the steepest drops during the COVID‑19 pandemic and statewide enrollments have not returned to pre‑pandemic levels. She noted institutional scale—UW around 50,000 FTE and WSU about 23,000 FTE—and that enrollments vary by resident and nonresident composition. On national comparison, staff said other states have seen similar trends and that the mix of resident and nonresident students in Washington complicates simple comparisons.
On tuition, Henry described the history of tuition‑revenue treatment: prior to 1993 the legislature set tuition and deposited revenue to the state general fund; since 1993 institutions have retained tuition revenue. The state currently caps the annual increase in resident undergraduate operating fees to no more than the average annual percentage growth in Washington’s median hourly wage (roughly 3% using the Bureau of Labor Statistics measure). Henry recounted the 2015 biennial policy that reduced resident undergraduate operating fees with a one‑time $167 million general‑fund backfill and noted adjustments tied to Seattle CPI and other budget provisions.
Henry outlined financial‑aid programs: the state provides more than $1 billion in financial aid in the 2023–25 biennium (staff clarified this amount refers to grants rather than loans) and the Washington College Grant (formerly the State Need Grant) was expanded to cover families up to higher percentiles of median family income (MFI). The statutory maximum award for the Washington College Grant is 55% of tuition in statute, but biennial budget actions have increased the maximum award to 65% for the current biennium; continuation requires budget action or a change in statute. College Bound eligibility, application and award rules were reviewed, including the requirement that recipients generally must be enrolled within a specified timeframe and meet residency and income thresholds.
Henry also explained the Workforce Education Investment Account (WIA), a revenue source created in 2019. The WIA funds have been used for Washington College Grant expansions, compensation adjustments, guided pathways, nurse educator support and other targeted investments. Henry said higher education accounts for about 8% of state NGFO (near‑general fund outlook) dollars in the 2023‑25 biennium (~$6 billion of $72 billion). When total budgeted funds are included (state, tuition and enterprise revenues), higher education represents about 13% of the statewide total (~$18.4 billion of $141 billion).
Representative questions covered national enrollment comparisons, the relation between CTC enrollment and the economy (CTC enrollment historically rises when the economy weakens), the difference between state‑funded FTEs and all FTEs (staff said most charts referenced state‑funded FTEs and excluded self‑sustaining programs), and details about financial‑aid caseload forecasting. Ranking Member Ibarra and other members pressed staff on the WIA account and unallocated reserves; Henry said part of the account’s balance is held in reserve and that the WIA board can propose allocations, but appropriations decisions are ultimately legislative.
Henry closed by emphasizing interdependence: changes in tuition, state appropriations and state‑supported financial aid are linked, so any change in one area affects the others. Committee members requested additional charts and data (longer tuition history, state funds per student by institution, federal vs. state split for financial aid) to be provided to the committee.
Ending: The briefing provided detailed baseline data committee members requested and set the stage for budget‑related questions and follow‑up; staff agreed to provide additional charts, historic data and the forthcoming caseload and fiscal projections.