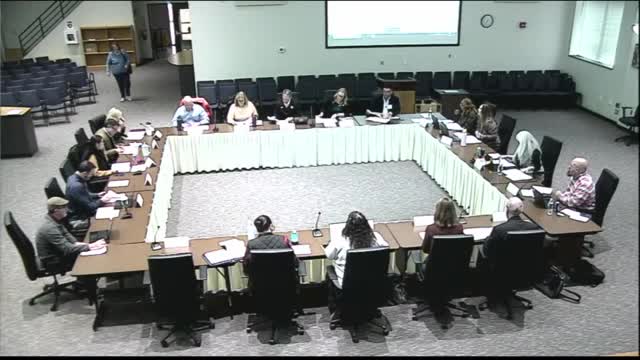
Board members press for clearer breakdown of staffing allotments and class‑size data
Get AI-powered insights, summaries, and transcripts
Subscribe
Summary
School staff explained state allotment formulas and local allocation choices for 'certified instructional support' jobs, and board members asked for comparative charts showing state versus local allocations, class‑size trends and a student‑facing vs. admin staffing breakdown.
School finance and leadership staff reviewed certified instructional support job descriptions, state allotment rules and district staffing choices and answered board members’ questions about how local allocations differ from the state formula.
Ashley Sutton, the district chief financial officer, said the state provides a single allotment for instructional support based on an enrollment formula that the presentation described as “1 for every 417 kids.” She explained the state’s allotment groups several job titles together under the label “instructional support” (counselors, social workers, instructional coaches and media coordinators) and does not break the allotment down by school. “The state allocation ends up being 1 for every 417 kids,” Sutton said, and the district uses a different local allotment to meet student needs and staffing practicalities.
Why it matters: Board members pressed for clearer, comparable data showing the state allotment versus the district’s local allocations, and asked for visuals — pie charts and bar charts — that separate certified, classified and administrative staff and show how many staff are school‑coded (student‑facing) versus central office coded.
Key points from the discussion
- State allotment vs. local assignment: Sutton and other staff explained that the state’s formula does not account for the district’s operational need to assign whole people to schools; as an example, the district provides one counselor to every elementary school regardless of whether the state allotment mathematically equates to 0.8 of a counselor at a smaller school. Sutton offered to provide a school‑by‑school breakdown showing how many staff each allocation would represent under the state formula and how the district actually assigns staff.
- Categories and forward‑facing staff: School leaders said payroll categories (certified, classified, administrative) drive many reports but do not map directly to whether an employee is student‑facing. Dr. Lawrence (presenter) described the district coding practice: “about 90% of the staff in the district are coded to schools,” and a small proportion (leadership/APs/principals) are coded as central office. Another speaker said central leadership comprises roughly 4% of staff. Board members asked for two charts: one showing certified vs. classified vs. admin and another showing forward‑facing versus administrative staff.
- Class size and pupil‑teacher ratios: Directors said the district tracks class sizes and that K–3 class sizes must meet statutory limits (examples cited for kindergarten and grades 1–3). Dr. Barnes said she monitors K–3 class sizes and that high‑school class counts are more complex because students take courses by subject area. The committee asked staff to provide year‑by‑year average class sizes (2018–2024) and an analysis showing whether classroom headcounts have changed enough to affect per‑pupil spending comparisons.
Actions and follow‑up asked by board members
Board members asked staff to produce: - A school‑by‑school comparison of the state instructional‑support allotment (the “1 per 417” rule) versus the district’s actual allocations; - A pie chart breaking out certified, classified and administrative staff; - A chart that groups staff as student‑facing versus administrative and shows the percentage coded to schools; - Historical average class sizes and a report on classes that exceed statutory limits (K–3) or district targets.
Ending: District staff agreed to provide the requested breakdowns and visual charts for the committee’s next meetings so board members and the public can more easily compare state allotments with local practice.
