Get Full Government Meeting Transcripts, Videos, & Alerts Forever!
Get email alerts on the Education Assessment Naep topic
No spam. Unsubscribe anytime.
Tennessee posts statewide gains on 2024 NAEP; SCORE urges focused goals to lift proficiency
Summary
Tennessee’s NAEP scores improved across fourth‑ and eighth‑grade math and reading in 2024, SCORE told the House Education Committee, but statewide proficiency remains low and targeted actions are still required.
Tennessee’s statewide NAEP (National Assessment of Educational Progress) results show gains across fourth‑ and eighth‑grade math and reading in 2024, presenters from the State Collaborative on Reforming Education (SCORE) told the Tennessee House Education Committee, while warning that overall proficiency rates remain low and targeted action is still necessary.
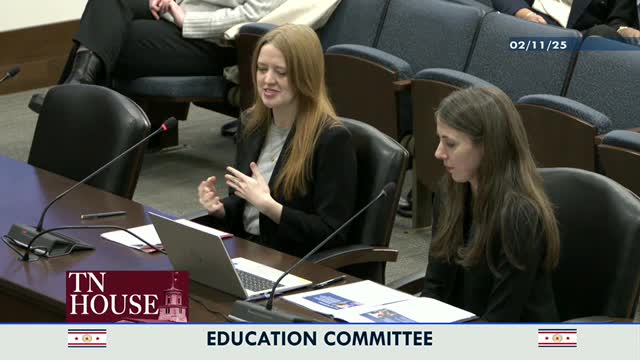
SCORE Vice President of Policy and Government Relations Aliyah Guthrie summarized two decades of state education work, and Alexis Parker, SCORE’s director of data, presented the 2024 NAEP findings and subgroup breakdowns. “For the first time ... Tennessee has surpassed the national average across all four assessments,” Guthrie said, adding that the state also showed growth since 2022 while national scores were largely flat or declining.
The presentation noted specific strengths and limits. Tennessee ranked in the top 25 among states for all four NAEP subjects and reached a high watermark at No. 13 for fourth‑grade math, the presenters said. Among subgroup results highlighted by SCORE, Black students ranked first nationally in eighth‑grade math by scale score. At the same time, presenters emphasized that only about one in three Tennessee K‑12 students are proficient across grades and subjects and only about one in four high school students are proficient across tested areas.
Why it matters: NAEP is the nation’s standardized comparative assessment; the committee was given the results to inform policy choices and to show where statewide strategies have produced gains and where more work is needed. Guthrie told legislators that policy decisions and investments have contributed to the recovery since the declines seen in 2022, but that proficiency rates must improve for long‑term student and workforce outcomes.
Key findings and context
- Test window and scope: The NAEP testing reported by SCORE took place January–March 2024 and covers all 50 states plus additional jurisdictions; the SCORE presentation focused on state‑level results, not district or school data. “NAEP ... is the only assessment that allows us to have a standardized measure of how students are performing across the entire country,” Alexis Parker said.
- State rankings and trends: Tennessee surpassed the national average for fourth‑ and eighth‑grade reading and math. From 2022 to 2024 Tennessee showed gains in all four assessed areas while the national trend was largely stagnation or decline; SCORE said Tennessee ranked among the top 10 states for improvement since 2022 in several measures.
- Subgroup performance: SCORE highlighted strong gains for Black students—particularly in eighth‑grade math—and noted narrowing of some gaps. The presentation also flagged persistent stagnation or low proficiency for economically disadvantaged students, with an achievement gap between economically disadvantaged and non‑economically disadvantaged students remaining over 20 NAEP scale points in some measures.
SCORE’s recommended five‑year goals
SCORE presented four aspirational goals for 2030 built on a “one additional student per classroom becomes proficient each year” modeling approach using Tennessee’s annual TCAP data as the base metric (the group emphasized the goals are modelled from TCAP, not NAEP):
- Third‑grade English/language arts: model moves proficiency from about 41% to 71% by 2030 if one additional student per classroom becomes proficient each year. - Seventh‑grade math: model moves proficiency from about 38% to 58% by 2030 under the same classroom increment assumption. - Postsecondary enrollment: increase from ~57% to ~77% by 2030 (students enrolling in TCAT, community college, or four‑year institutions under the modeling assumption). - Postsecondary completion: increase from ~44% to ~64% on‑time completion by 2030; SCORE also proposed that 75% of those credentials should be “high‑impact” credentials aligned to high‑wage, high‑demand careers.
SCORE executives said the goals are intentionally tangible and tied to statewide TCAP metrics; they repeatedly described the targets as aspirational, not guarantees.
Lawmakers’ questions and committee discussion
Committee members used the presentation to probe several policy questions: how state and federal dollars (including ESSER fund strategies) were used during recovery, how to sustain and expand the teacher pipeline, whether accountability should follow public dollars to private schools, and how to accelerate gains for economically disadvantaged and rural students.
- Accountability for private‑school voucher/education savings account (ESA) students: Representative Rebs McKenzie and others asked how students funded through ESA programs will be tracked, since such students often do not take the state TCAP. Guthrie said SCORE focuses on public education and will continue to monitor NAEP and TCAP; she noted private‑school students can be sampled in NAEP but that NAEP state‑level reporting typically lacks sufficient sample size for private‑school reporting, meaning those private‑school scores are often only reportable at the national level.
- Teacher pipeline and retention: Lawmakers raised concerns that vouchers and changing school models could draw teachers out of the public system. Guthrie and other SCORE staff emphasized both recruitment (scholarship and licensure supports were discussed) and retention strategies: improve teacher working conditions, reduce non‑instructional burdens, expand preparation pipelines and use targeted professional learning.
- Persistent gaps: Committee members pressed for explanations of why economically disadvantaged students had not shown the same improvements as some subgroup gains. SCORE’s data director said urban English learner populations showed gains in some areas while rural students sometimes declined; overall the gap between economically disadvantaged and non‑economically disadvantaged students had not narrowed and remained an area for focused policy work.
Discussion vs. formal action
The committee received the presentation and engaged in questions; no formal motions or votes on legislation occurred during the session. Members referred to existing and filed legislation (teacher scholarships and licensure bills were referenced in discussion) but the meeting did not adopt formal committee actions.
Ending
SCORE told lawmakers the new NAEP results offered cause for cautious celebration but also renewed urgency. “These results are just a snapshot to help us understand where we are relative to other states. But policy matters and these results mean that students are more prepared for their future,” Aliyah Guthrie said. Legislators asked SCORE to share written materials and follow‑up data and indicated the committee will continue oversight and bill‑by‑bill work to address teacher pipeline, accountability and persistent gaps.
Speakers
- Aliyah Guthrie — vice president of policy and government relations, SCORE (State Collaborative on Reforming Education). - Alexis Parker — director of data, SCORE. - Representative Rebs McKenzie — member, Tennessee House (asked questions and introduced Fisk guests earlier in the meeting; committee member). - Representative Reginald Hakeem — member, Tennessee House (questioner; referenced students and teacher pipeline during Q&A). - Multiple committee members asked questions during the Q&A (Representative Stevens, Representative Bolso, Representative Glenn and others as recorded in the transcript). Quotations and attributions in this article are limited to the speakers listed above and to statements appearing in the committee transcript.
Authorities
- NAEP (National Assessment of Educational Progress) — referenced by SCORE and presenters (type: other). Referenced by: article text. - National Assessment Governing Board (NAGB) — referenced as NAEP’s governing body (type: other). Referenced by: article text. - TCAP (Tennessee Comprehensive Assessment Program) — state assessment referenced by SCORE and used in SCORE’s TCAP‑based modeling (type: other). Referenced by: article text. - ESSA (Every Student Succeeds Act) — federal statute referenced in the presentation as the federal plan context for Tennessee (type: statute). Referenced by: Alexis Parker remarks. - ESSER (Elementary and Secondary School Emergency Relief) — federal grant funding referenced in discussion of recovery strategies (type: grant). Referenced by: Aliyah Guthrie remarks.
Actions
No formal committee motions, votes, or enactments occurred during the portion of the meeting covering SCORE’s presentation; therefore there are no recorded votes or motions from this agenda item in the transcript.
Clarifying details
- NAEP testing window: January–March 2024 (presented by Alexis Parker). (category: testing window) - Current reported proficiency estimates used by SCORE: about 1 in 3 K‑12 students proficient across grades/subjects; about 1 in 4 high‑school students proficient across assessed subjects (category: proficiency baseline). - Modeling assumption for SCORE goals: “one additional student per classroom becomes proficient each year” using TCAP as base data (category: modeling method). - Third‑grade ELA projection under SCORE model: from ~41% to ~71% by 2030 (category: goal projection). - Seventh‑grade math projection under SCORE model: from ~38% to ~58% by 2030 (category: goal projection). - Postsecondary enrollment and completion projections (current enrollment ~57% → 77% by 2030; completion ~44% → 64% by 2030) (category: postsecondary targets). - Subgroup notes: Black students ranked first nationally for eighth‑grade math by scale score (category: subgroup performance). - Geographic/setting differences called out: urban English‑learner gains vs. some rural declines (category: geography variation).
Proper names
[{"name":"SCORE","type":"organization"},{"name":"National Assessment of Educational Progress","type":"other"},{"name":"National Assessment Governing Board","type":"other"},{"name":"Tennessee Comprehensive Assessment Program","type":"other"},{"name":"Every Student Succeeds Act","type":"other"},{"name":"ESSER","type":"other"},{"name":"TCAT","type":"program"},{"name":"Memphis Shelby County Schools","type":"organization"}]
Community relevance
- Geographies: state of Tennessee; urban/rural distinctions called out in subgroup analysis. - Impact groups: economically disadvantaged students, Black students, English learners, teachers (teacher pipeline/retention issues). - Funding sources: ESSER funds referenced as part of the recovery strategy.
Meeting context
- Engagement level: speakers_count:14, duration_minutes:74, items_count:2 (SCORE presentation; Fisk University reintroduction). - Implementation risk: medium (policy changes such as ESA/voucher accountability and teacher pipeline interventions depend on legislation and coordination across agencies). - History: presenters traced Tennessee’s performance and reforms back to 2007–2019 reforms and noted recovery since 2022 NAEP declines.
Searchable_tags
["NAEP","SCORE","TCAP","Tennessee education","third grade literacy","teacher pipeline","ESSER","postsecondary outcomes"]
Provenance
{"transcript_segments":[{"block_id":"block_1199.575","local_start":0,"local_end":120,"evidence_excerpt":"My name is Alexis Parker. I'm the director of data at Tennessee SCORE. So I'll be really digging into the data. I'm really excited to share this with the committee today. But first, I wanna spend a little bit of time explaining what are we talking about today? What is the NAEP assessment? And so NAEP or the National Assessment of Educational Progress, also known as the nation's report Card, is the only assessment that allows us to have a standardized measure of how students are performing across the entire country.","reason_code":"topicintro"},{"block_id":"block_3969.81","local_start":0,"local_end":80,"evidence_excerpt":"Anyone else on the list want to, ask a question or comment? Thank you all so very much. This is a very special and appreciate you, y'all bringing this before us. Very educational. We're now back in session and Chairman Cipiche.","reason_code":"topicfinish"}]}
salience":{"overall":0.78,"overall_justification":"Statewide NAEP gains and subgroup changes affect statewide K‑12 policy, funding decisions, and teacher workforce planning; presenters proposed measurable five‑year goals tied to TCAP."},"topics":[{"name":"education-assessment-naep","justification":"Primary subject of the presentation: statewide NAEP 2024 results, subgroup analysis and recovery since 2022.","scoring":{"topic_relevance":0.95,"depth_score":0.85,"opinionatedness":0.05,"controversy":0.45,"civic_salience":0.9,"impactfulness":0.82,"geo_relevance":1.0}}]}, {