Get Full Government Meeting Transcripts, Videos, & Alerts Forever!
Get email alerts on the School Performance topic
No spam. Unsubscribe anytime.
District shows gains on 2025 Iowa School Performance Profiles; absenteeism and career-learning participation cited as drivers
Summary
District staff presented the 2025 Iowa School Performance Profiles, reporting district growth in state ratings, notable increases at Grimes, Aldo and the high school, a sharp reduction in chronic absenteeism and higher rates of students in work-based learning and concurrent college credit.
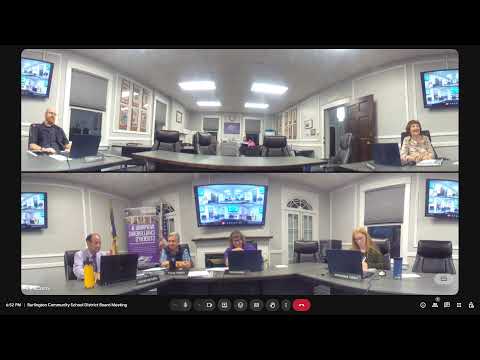
District staff presented the 2025 Iowa School Performance Profiles to the Burlington Community School District board on Oct. 6, 2025, reporting modest overall growth and larger gains in several buildings and indicators.
Curriculum staff said the district’s average growth was 2.3 percentage points, matching the statewide average, and highlighted three buildings that moved up one rating category: Grimes Elementary, Aldo and the high school.
Why it matters
The profile ratings are used statewide to compare building performance on proficiency, growth and other indicators. For Burlington, staff pointed to improvements that district leaders said reflect investments in attendance efforts, English-learner support, and career and technical education.
Details presented
- District average growth: 2.3 percentage points (same as state average). - Buildings moving up: Grimes (+10 percentage points), high school (+8), Aldo (+4). - Chronic absenteeism: district rate reduced from 42% to 29%; state change was a 6 percentage-point decrease. - Work-based learning: increased from 55% to 75% of high school students participating in courses with work-based components. - College credit: percent of graduates earning at least one college credit rose from 39% to 51%; district staff noted a high share of in-person concurrent-enrollment instruction taught by district instructors. - English learner (EL) growth: subgroup growth increased from 48% to 72%; the district increased EL staffing from one certified teacher to two and assigned them to more buildings. - CTE/Pathway examples: EMT enrollment grew to six students this year compared with three in the previous four years combined.
District staff noted that some profile calculations weight different subjects more heavily when schools lack specific tested grades (for example the district’s K–4 elementary configuration places more weight on English and math where science is not tested at those grades). Staff also cautioned that subgroup measures require minimum counts and two years of data to register growth.
Quotes and attribution
“The Iowa School Performance Profiles are a statewide system of evaluating every school building in Iowa based on a variety of factors,” said Corey Johnson, curriculum staff member who gave the presentation.
What comes next
Board members requested availability of deeper data and flagged opportunities for a work session; staff offered to schedule a multi-hour data review for board members who want a deeper dive. District staff said they will continue to monitor attendance, EL supports and CTE pathways as part of improvement planning.
Source materials and where to look
District staff directed board members and the public to schoolperformance.com for full building-level profile data and said the district will make more detailed reports available in follow-up work sessions.