Get Full Government Meeting Transcripts, Videos, & Alerts Forever!
Get email alerts on the Tisa Funding Dashboard topic
No spam. Unsubscribe anytime.
Comptroller's Office tutorial explains Tennessee TISA school funding dashboard
Summary
A Comptroller of the Treasury tutorial describes how the Tennessee Investment in Student Achievement (TISA) dashboard displays 2024–25 statewide and district-level K–12 funding by component and shows district-required local match and state allocations.
The Comptroller of the Treasury provided a brief online tutorial showing how the Tennessee Investment in Student Achievement (TISA) dashboard displays statewide and district funding for the 2024–25 school year.
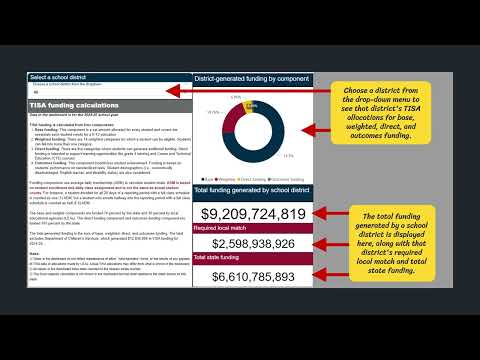
The presenter for the Comptroller's Office said the dashboard highlights “statewide and district funding through the Tennessee Investment in Student Achievement, also known as TISA, the state's K–12 funding formula,” and that users can select a district to view that district’s allocations for base, weighted, direct and outcomes funding.
The tutorial explained the dashboard’s main pages. The second page shows base funding calculated from average daily membership and lists the weights that generate additional funding for certain student populations. A separate page shows direct funding allocations intended to support opportunities beyond classroom instruction. An outcomes page presents additional funding districts receive based on student academic performance. The presenter directed users to OREA’s website for a TISA landing page and additional resources, saying, “See OREA's main website for our TISA landing page.”
The presenter noted the dashboard displays each district’s total funding generated, the district’s required local match and the total state funding. The tutorial identified the data as district- and statewide-level allocations for the 2024–25 school year and the four TISA components: base, weighted, direct and outcomes funding.
No formal actions, motions or votes were recorded in the tutorial. The session was an informational demonstration of the dashboard’s navigation and data fields rather than a policy debate or decision point.
Users seeking more detail were directed to the Comptroller Office’s OREA resources, where the dashboard and related reports and infographics are hosted.