Get Full Government Meeting Transcripts, Videos, & Alerts Forever!
Get email alerts on the Academic Performance And Accountability topic
No spam. Unsubscribe anytime.
Commission staff present statewide charter school landscape, 2023–24 TCAP findings and estimated 2024–25 preview
Summary
Commission staff presented a statewide charter school data overview for 2023–24 and an estimated preview for 2024–25, highlighting enrollment, subgroup composition, TCAP success rates and value‑added growth measures for charter schools and the commission’s portfolio.
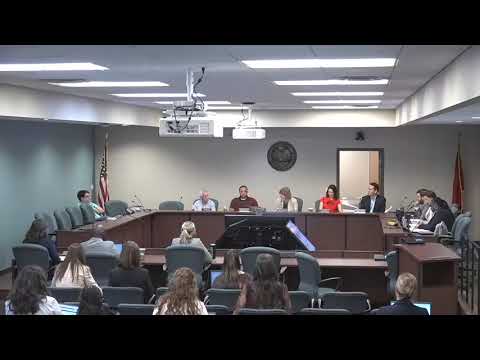
At its July 25 meeting the Tennessee Public Charter School Commission received a data briefing on the statewide charter school landscape for school year 2023–24 and an estimated preview for 2024–25.
Rebecca Laidebore, the commission’s data and accountability coordinator, opened by reminding commissioners that Tennessee charter schools are public schools “operated by independent, non‑profit governing bodies” and that most data in the presentation came from the Tennessee Department of Education. Laidebore said the commission’s analysis used the Department’s October 1 enrollment snapshot for 2023–24 and noted statewide figures are lagged by one school year.
Key takeaways the commission heard: - Enrollment and composition: About 4.5% of public school students statewide attended a public charter school in 2023–24. In geographic districts that host charter schools, about 15% of students attended charter schools. The largest concentrations of charter schools were in the Memphis and Nashville areas; Commissioner Laidebore noted Rutherford County will be visible in next year’s data as new schools opened in 2024–25. - Subgroup representation: Charter schools statewide served a higher percentage of Black/Hispanic/Native American (BHN) students and economically disadvantaged students than the resident districts and the statewide average; patterns for English learners and students with disabilities showed more variation. Laidebore reported the commission’s own portfolio has seen an increase in the percentage of students with disabilities. - State accountability (letter grades) and success rates: For 2023–24 the statewide letter grade distribution showed 75% of charter schools earned a letter grade C or higher compared with 64% of non‑charter public schools in those districts; the commission’s portfolio showed 92% earning a C or higher. On proficiency (TCAP success rate, ELA and math, grades 3–12), statewide averages generally exceeded both resident districts and charter schools, though performance by subgroup produced mixed results. Laidebore emphasized comparisons should be made carefully because some district aggregates include charter schools and because different accountability business rules changed over time. - Growth (TVAS/TVOS): The commission heard that charter schools met or exceeded growth expectations for 2023–24 at a higher rate than resident districts and the state. Laidebore said more than half of charter schools achieved a Level 5 (significantly more growth than expected) in TVOS for 2023–24, and the commission’s schools met or exceeded growth at a higher rate than district or statewide averages. - Commission preview (estimated 2024–25 results): Laidebore presented estimated proficiency for the commission’s portfolio for 2024–25 (estimates, not final). She highlighted an estimated increase of about three percentage points in success rates for commission schools from 2023–24 to the 2024–25 estimate in both ELA and math, exceeding statewide estimated gains.
Promotion pathways and tutoring outcomes: The commission also reviewed the state’s third‑grade promotion law (passed in 2021) and how promotion pathways were reflected in commission data. Laidebore described cohort analyses that track unique students from third to fourth grade. For students eligible for promotion through the “adequate growth” pathway (students who did not meet proficiency but could reach fourth grade by meeting a growth target after tutoring), the commission heard that roughly a quarter of fourth‑grade students in commission schools were promoted via that pathway; of those students, about 37% met adequate growth or reached proficiency while 63% did not meet the adequate growth threshold in the presented year. Laidebore said numbers can fluctuate across cohorts and that the 2024–25 numbers included new schools in the portfolio, which can affect year‑to‑year comparisons.
Commissioners asked several technical questions about the data, including whether district aggregates included charter schools (Laidebore said many district averages include charter schools to avoid suppression in small‑n reporting), how October 1 enrollment snapshots affect attribution and accountability, and the availability of disaggregated files once the state unembargoes accountability files (staff said full assessment files should be available in mid‑August for deeper review). Chair Richards and commissioners urged staff to provide additional cross‑tabulations that compare commission‑authorized charters to resident‑district operated charter schools within the same geographic district (for example, commission‑authorized schools located in Metro Nashville Public Schools compared separately to MNPS‑authorized charter schools and to non‑charter schools in the same district).
Rebecca Laidebore cautioned that the commission’s 2024–25 figures were estimates and that the department’s full accountability files will provide the most complete, auditable data. She also noted the Achievement School District (ASD) is ceasing operations at the end of the 2025–26 year, which will affect future statewide breakdowns.
Why it matters: The briefing provides the commission evidence to inform renewal decisions, preopening readiness reviews and policy work (for example, how to monitor outcomes for students with disabilities and how promotion‑pathway tutoring is working). Commissioners asked staff to return with more granular comparisons by resident district and operator as soon as statewide accountability files are available.
Ending: Staff said they will provide preliminary assessment‑level files to commissioners when the state unembargoes them, and they will continue cohort and school‑level analyses to support reviews and governing‑board briefings.