Get Full Government Meeting Transcripts, Videos, & Alerts Forever!
Get email alerts on the Cjc Dashboards topic
No spam. Unsubscribe anytime.
Dane County CJC staff demonstrate public dashboards showing crime trends, pretrial and jail data
Summary
CJC staff demonstrated publicly available dashboards with crime trends, arrest and pretrial data, a daily jail snapshot and analyses of signature bonds that show racial gaps in pretrial release. Presenters and committee members discussed data updates, limits and possible uses for planning.
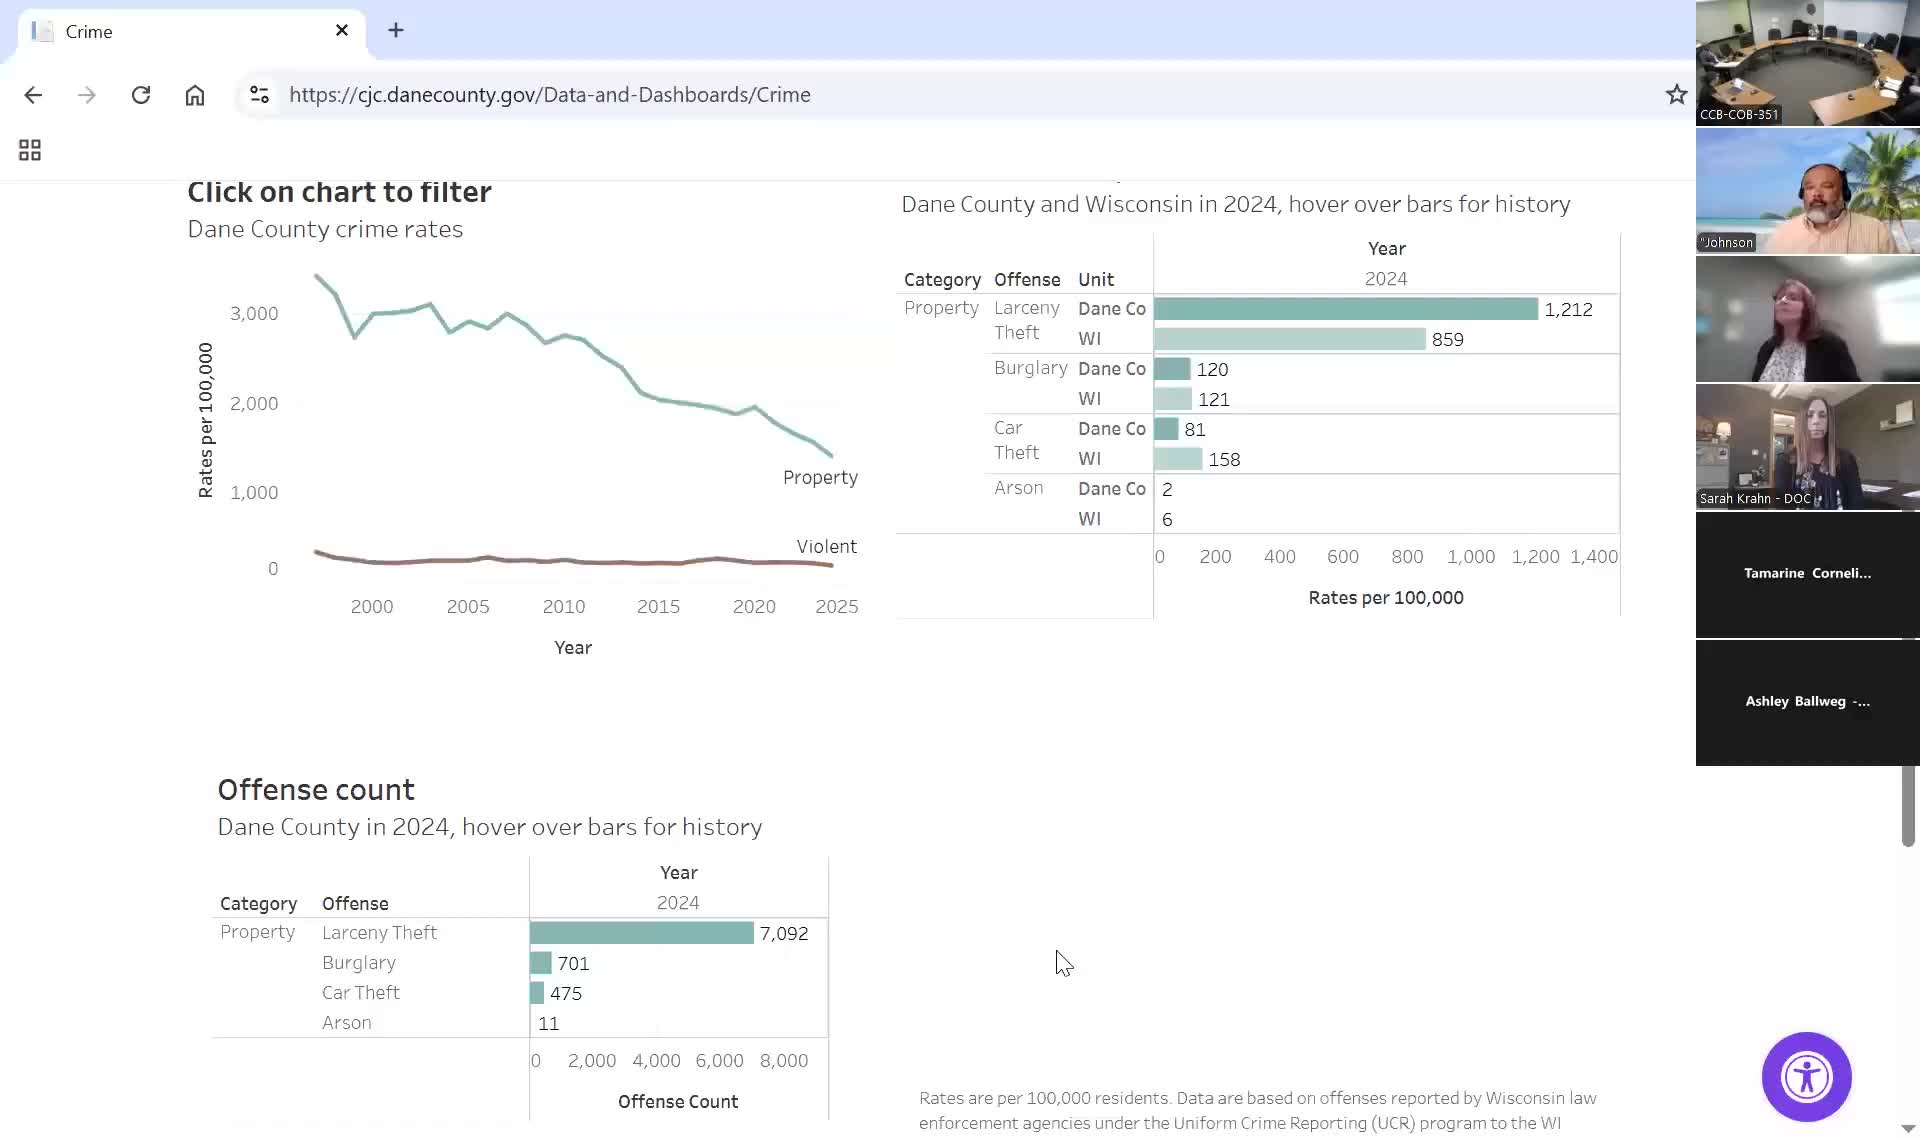
Colleen, a Criminal Justice Council (CJC) staff member, demonstrated a set of public dashboards on crime and criminal justice outcomes for Dane County and Wisconsin during a CJC subcommittee meeting. The presentation covered long-term crime trends, arrest and incarceration snapshots, pretrial status, signature-bond analyses and a corrections dashboard.
The dashboards show a long-term decline in property-crime rates in Dane County across roughly 15–25 years, with a notable temporary spike in some offenses such as car theft before returning to earlier levels. "It's fallen by a third," Colleen said when discussing the change in arrest counts over the last 25 years. The presenter showed interactive filters that allow users to compare Dane County to state trends and to break data down by offense type, year, age, race and gender.
Why it matters: the dashboards are intended as tools for the council and partners to track racial disparities, pretrial outcomes and jail populations and to support evidence-based policy work.
Key findings shown in the presentation
- Race and arrests: Colleen demonstrated a dashboard comparing the county population (shown as 84% White, 6% Black in the presenter’s example) with the racial composition of arrests for a category labeled "society crimes," where White people accounted for 63% of arrests for that category in the selected view. A committee member asked how arrest shares compare to incarceration shares; Colleen said that particular dashboard does not contain incarceration data and recommended looking at other dashboards that include incarceration.
- Arrests and juveniles: the presenter noted juvenile arrests have "fallen precipitously" while adult arrests account for most of the remaining counts.
- Pretrial status: the pretrial dashboard indicates most people with pending cases remain in the community rather than in custody. About two-thirds of people make all scheduled court appearances, while about one-third miss at least one appearance. The presenter said roughly 77% of people with pretrial status did not acquire an additional case while on pretrial; those who did generally accumulated nonviolent offenses. The presenter gave counts: about 4,000 people had a pending court case in the dataset shown, while only about 200 people were under formal pretrial supervision such as GPS or drug testing.
- Jail snapshot: the jail snapshot is a time-limited "photo" (data pulled at 12:07 a.m. on the day of the presentation) and is updated nearly every day. The presenter emphasized that the snapshot can change from minute to minute. The dashboards show that many people in the jail at the snapshot time had not been convicted of the charges for which they were being held; a committee member read that as "about half" not convicted and the presenter agreed that many people in custody were pretrial.
- Signature-bond analysis: the presenter reviewed a research expansion of a Judge McNamara study that includes race and gender. Across the period shown, 67% of criminal cases received a signature bond at some point, but the share differed by race: 59% for cases with Black defendants versus 73% for cases with White defendants in the summary table the presenter displayed. The presenter and data shown indicated Black men were the least likely demographic group to receive signature bonds across felony classes (Class B through Class E) in the dataset.
- Corrections: a monthly-updated corrections dashboard shows the number of people from Dane County convicted and placed in prison, with demographic breakdowns. The presenter cited a figure (as displayed in the dashboard) of 636 Black people from Dane County convicted and in the prison system and noted that the population shown was heavily male (the presenter said about 96% male in that subgroup).
Data update cadence and scope
- Crime trends and arrest trends: updated annually. - Pretrial status: updated monthly. - Jail snapshot: updated daily/nearly daily (presenter called it a snapshot taken at a specific time). - Corrections: updated monthly. - The presenter noted that the dashboards draw on local agency reporting and FBI categorizations where relevant and that data-sharing agreements govern what is shared and how it is secured.
Limits and how committee members used the dashboards
Committee members asked for comparisons the dashboards do not show (for example, how arrests by race compare to incarceration by race for the same individuals). The presenter reiterated that some dashboards (not the arrests dashboard) contain incarceration or corrections data and suggested using cross-dashboard filters or follow-up analyses. Colleen thanked Michelle DeForest from the Sheriff’s Office for assistance with the jail dashboard data.
Ending
The presenter closed the demonstration by reminding members the dashboards are on the CJC website, are regularly updated, and that staff are available as thought partners for agencies or committees that want specific analyses.