Get Full Government Meeting Transcripts, Videos, & Alerts Forever!
Get email alerts on the Local Energy Infrastructure topic
No spam. Unsubscribe anytime.
Berkeley Lab presents 2040 energy roadmap: solar and storage can supply peak demand but imports, curtailment, and resiliency remain key issues
Summary
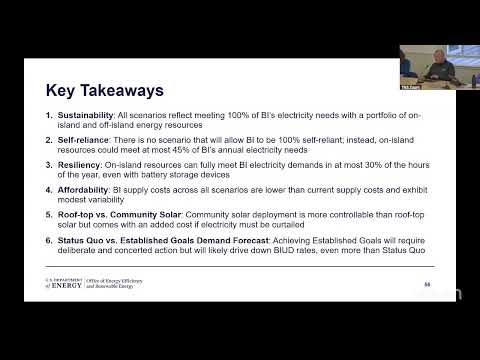
Peter Kappers, a technical lead with Lawrence Berkeley National Laboratory, told the Block Island Utility District that on‑island solar, a small biofuel generator and battery storage can meet peak hourly demand in many hours by 2040 but would supply only about 45% of the island’s annual electricity and still leave the island importing most of its energy.
Peter Kappers, a technical lead with Lawrence Berkeley National Laboratory, told the Block Island Utility District and residents on June 5 that a portfolio of on‑island solar, a small biofuel generator and battery storage could meet Block Island’s peak hourly demand in many hours by 2040 but would still leave the island importing the majority of its annual electricity.
Kappers, presenting results from a Department of Energy technical‑assistance project (ETIP) led by the National Renewable Energy Laboratory with regional partner the Island Institute, said the analysis modeled rooftop solar, community (ground‑mounted) solar and a small biofuel generator, and tested demand scenarios that reflect modest (status quo) and aggressive (established goals) electrification and efficiency uptake.
The report’s key findings: on‑island resources could meet maximum hourly demand in a sizable share of hours (about 30% in the team’s primary scenario), but those same resources would supply at most about 45% of the island’s annual energy needs; without storage, 19–23% of on‑island solar energy would need to be curtailed; and battery storage reduces curtailment and imports but does not eliminate the need to buy energy over the undersea cable.
Why it matters: Block Island has a two‑way undersea cable that allows imports from the mainland but, under existing arrangements tied to the island’s offshore wind project, cannot export power back to the mainland. That constraint means any electricity produced on the island must be consumed locally or stored, which raises unique operational, contractual and economic trade‑offs for community solar, rooftop systems and storage.
Most important details
- Resource potential: A GIS screening identified roughly 720 acres of land potentially suitable for community (ground‑mounted) solar, equivalent to about 40 MW of capacity. A rooftop analysis estimated roughly 1,850 suitable rooftops at an average system size near 5.1 kW, producing about 9.5 MW of rooftop capacity under the study assumptions.
- Demand outlook: The lab’s status‑quo load projection shows summer peak demand near 7–7.5 MW in 2040; an “established goals” electrification case could raise peak demand toward about 10–13 MW and shift the utility from a summer peak to a winter peak because of building electrification and electric water‑heater adoption.
- Curtailment and storage: With large solar deployment and no storage, the team estimated 19–23% of on‑island solar energy would be curtailed to maintain supply‑demand balance. Four‑hour lithium‑ion batteries (modeled with contemporary round‑trip losses of about 25–30%) reduced curtailment and lowered annual imports, but even with batteries imports remained the majority share of annual energy (the analysis showed imports of roughly 60–80% depending on cases).
- Costs and rate impact: Using the supply‑cost assumptions in the analysis, the team found scenario retail‑rate equivalents ranging roughly in the mid‑single digits to low double‑digit cents per kWh (examples shown around 7–10¢/kWh on modeled scenarios). Kappers emphasized the study did not include certain capital distribution upgrades that would be required if peak demand materially increases.
- Operational and contractual constraints: The utility’s current tariff treatment lets the district curtail rooftop systems installed under its qualifying facility/buy‑all‑sell‑all program without compensating the customer; community solar contracts are typically “take‑or‑pay,” meaning the utility would be required to pay the developer for contracted energy even if the utility asks for curtailment. The team modeled curtailment first against rooftop systems (because of current tariff structure) and then community solar when additional curtailment was needed.
What commissioners and staff said
Commissioner Jeff (identified in the meeting as a utility commissioner) described the local substation as rated for 6 MW and said the utility can temporarily reach about 7.5 MW by engaging additional cooling, but that sustained load above that would require multi‑million‑dollar upgrades and potentially system‑wide transformer replacements. "Our substation right now is rated for 6 megawatts," he said, noting upgrades beyond about 7.5 MW would be costly.
Utility commissioners and attendees also emphasized price certainty and the risks of large spot‑market exposure. A utility representative explained wholesale purchases are bid in advance into ISO New England and deviations become spot‑market exposure; the district seeks to minimize spot purchases because spot prices can be volatile.
Policy direction and next steps
- The utility indicated it expects to develop a curtailment policy in the fall and said it will likely begin curtailing solar during generator operations and in light‑load months to manage variability; the utility will continue pursuing more detailed analysis and procurement work (community solar RFPs and storage paired with projects were discussed). Commissioner comments requested analysis that prices resiliency for long‑duration outages, not only short‑duration smoothing.
- Berkeley Lab said it will publish a fuller technical report and supporting slides; Kappers said the final technical report would follow the presentation and was expected in the summer (the lab also provided the utility district with earlier slide sets and a forthcoming technical report documenting inputs and assumptions).
Context and caveats
Kappers stressed that the 2040 pathways depend strongly on choices the community makes about demand (EV adoption, building electrification, energy efficiency) and on contractual design for solar and storage projects. He also noted the team deliberately used conservative, well‑vetted technology and cost assumptions (four‑hour lithium‑ion battery baselines) rather than speculative long‑duration storage technologies.
Kappers and utility speakers repeatedly noted the island’s inability to export power under current offshore‑wind agreements constrains options; changing that constraint would require negotiation with the wind project developer and likely re‑engineering agreements.
Ending
The lab’s presentation left commissioners with a choice framework: the island can pursue large amounts of on‑island solar and storage and achieve a high share of renewable consumption at peak hours, but doing so raises trade‑offs among self‑reliance, resiliency and affordability that the utility and community must weigh in procurement and tariff design. Berkeley Lab will deliver a written report with the full analytics this summer and the utility said it will continue refining procurement plans and a curtailment policy this year.
Quotes (selected)
"You can meet maximum demand on the island in many hours, but those on‑island resources provide only about 45% of annual energy," Peter Kappers, Lawrence Berkeley National Laboratory, said during the presentation.
"Our substation right now is rated for 6 megawatts," Commissioner Jeff said, noting the utility can temporarily reach 7.5 MW with cooling but that further sustained load would require major upgrades.
"If you want to be 100% self‑reliant for long cable outages, you would need very large battery deployments or rely on diesel generators," a utility panelist said, emphasizing the high capital and spatial requirements for long‑duration storage.
Sources and limitations
The article is drawn directly from the public presentation and Q&A recorded in the meeting transcript, including statements by Peter Kappers (Berkeley Lab), representatives of the Block Island Utility District, and Island Institute staff. The analysis cited reflects the lab’s modeled scenarios and the assumptions the presenter identified; where numeric values were discussed at the meeting they are reported here as presented by the speakers. This article does not infer commitments beyond those explicitly stated by presenters or commissioners.