Pittsburgh Public Schools shows modest spring gains in third-grade math but large subgroup gaps remain
Get AI-powered insights, summaries, and transcripts
Subscribe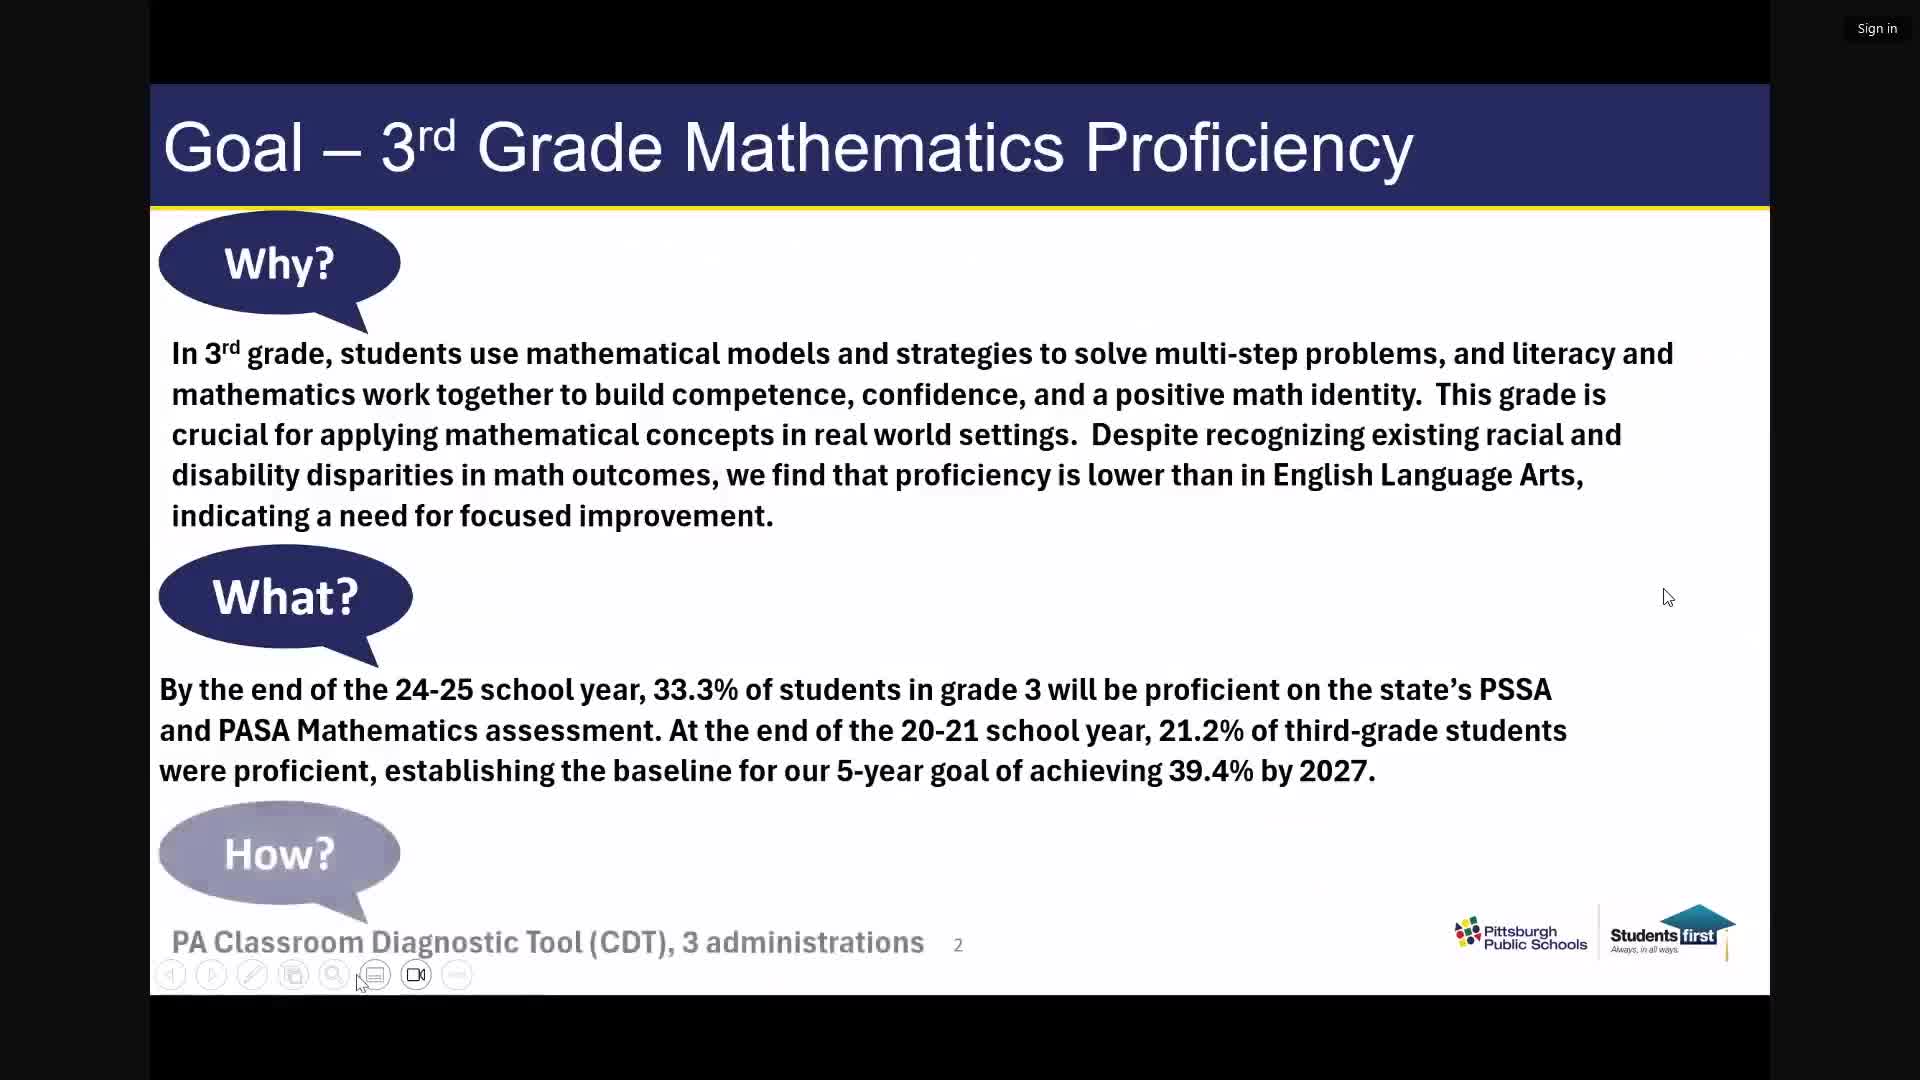
Summary
Superintendent Dr. Wayne Walters told the Education Committee on May 13 that spring Classroom Diagnostic Tool results show 21.5% of third-graders at or above grade level, with larger gains for white students than for Black students; district leaders cited curriculum change, coaching limits and plans for more targeted supports.
PITTSBURGH — Superintendent Dr. Wayne Walters told the Pittsburgh Public Schools Education Committee on May 13 that spring Classroom Diagnostic Tool (CDT) results show 21.5% of this year’s third-graders are performing at or above grade level, an increase from the winter administration.
The district is tracking toward an end-of-year goal of 33.3% proficiency on state assessments for the 2024–25 school year, but Walters cautioned that gaps between subgroups remain wide and additional work is required to reach the target. “We want students not only to know math, but to understand it deeply, to persevere when it gets hard, and to see themselves as capable mathematicians,” Walters said during the committee’s monthly goal-monitoring presentation.
The presentation differentiated two CDT measures district staff use: the percentage of students performing at or above grade level (21.5% on the spring CDT) and a separate “likely proficient or advanced” calculation, which Walters said was 8% this spring (down from 9.1% the prior year and 11.4% the year before). Walters attributed some movement in the data to this year’s adoption of a new, problem-based curriculum, Illustrative Mathematics, replacing Go Math.
District leaders reported growth from winter to spring on the CDT for multiple subgroups but said disparities persist. Walters reported a 4.5 percentage-point increase for Black students and a 14.2 percentage-point increase for white students between the winter and spring CDT administrations. He said 91.4% of Black third-graders remained below grade level in the spring CDT, compared with 57.9% of white third-graders in the red range (not performing at or above grade level). Students with individualized education programs (IEPs) gained about 4 percentage points, English language learners gained about 9 points, and economically disadvantaged students gained about 5.3 points from winter to spring.
District staff described three main strategies intended to raise third-grade mathematics outcomes: building positive math identity among students, curriculum-based professional learning for teachers and leaders, and math language routines to strengthen mathematical communication. Specific steps this year included three principal professional-learning sessions (the Leading and Learning Institute), shifting third-grade unit-unpacking sessions to district half days to increase teacher participation, distribution of eight math-language-routine posters to every third-grade classroom, and family math-night materials shared with schools via the district’s Schoology learning platform.
Walters acknowledged first-year implementation challenges associated with a curriculum shift. “Fidelity simply means following the rules,” he said when asked to define fidelity of implementation, adding that inconsistent classroom implementation and limited professional-learning time have constrained impact this year. Lindsey Smith, the district’s executive director for K–12 STEM, described the district’s monitoring practice. “We conduct math walks three times a year. They’re classroom visitations that are not connected to teacher evaluations,” Smith said, explaining math walks are used to assess curriculum implementation and to collect districtwide trends on classroom practice.
District-collected measures showed some classroom-level improvements: third-grade teachers’ cultivation of inclusive classroom environments rose from 29% at the start of the year to 66% midyear, and student-reported enjoyment of math rose to 85% on a midyear survey (up from 82%). Observation results also showed increases in student academic discussion opportunities and use of problem-based lesson structures. Walters and staff flagged capacity constraints: five math coaches currently support more than 400 elementary teachers, meaning each coach oversees about 80–95 educators.
Board members raised questions about supports and scale. Board member Ms. Silk asked how reconfiguring the district might help the work; Walters said reconfiguration could concentrate teachers and allow more departmentalization so teachers can specialize and coaches can be less thinly spread. Board member Mr. Walker asked whether the district has learned from other districts; Walters said the district has reached out to other districts and university partners but noted national challenges with math proficiency and that the curriculum and practice expectations have shifted.
District staff identified next steps including improving student survey instruments to allow demographic disaggregation, continuing embedded coaching with a stronger focus on inclusive instruction and math identity, resuming and expanding principal professional learning on math language routines, refining family engagement tracking for the 2025–26 year, and exploring ways to expand math coaching capacity possibly connected to future school reconfiguration.
The presentation and discussion did not include formal votes or binding board actions. Walters closed by reiterating the district’s commitment to continuous improvement and transparency in tracking the third-grade math goal.