Get Full Government Meeting Transcripts, Videos, & Alerts Forever!
Get email alerts on the Special Education topic
No spam. Unsubscribe anytime.
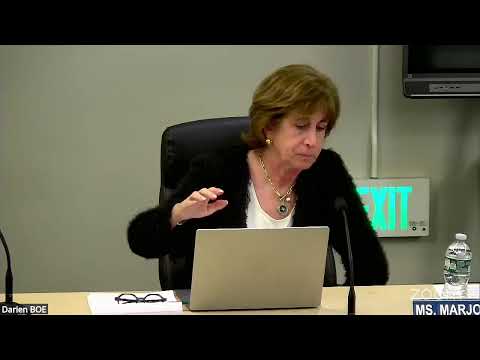
Darien review finds elementary special‑education classifications up; board asks MTSS follow‑up
Summary
A district self‑study presented to the Darien Board found K–5 classification rates increased over five years, especially in second grade; staff recommended MTSS calibration, eligibility‑decision review and improved data collection; the board requested quarterly follow‑up and state report‑card and absenteeism data.
District staff presented a special‑education self‑study showing an increase in elementary special‑education identification rates and proposed next steps to strengthen pre‑referral interventions and data systems.
What the study found: Staff reported Darien’s K–5 identification rate rose from 13.83% to 17.73% over five years (285 to 376 students in K–5), with the largest increases concentrated in second grade and across a single cohort that entered kindergarten during the COVID years. For the current year, the district recorded 102 referrals to special education; 50 had been found eligible as of the presentation and 19 evaluations remained in progress. Of the students referred who had engaged SRBI (school response to intervention) prior to referral, 9 had been in Tier 1, 24 in Tier 2 and 16 in Tier 3 prior to referral.
Other notable findings presented: - Approximately 80% of the increase reflected specific learning disability and other health impairment (including ADHD). - Chronic absenteeism among K–5 students rose significantly after 2019–20; staff highlighted the potential instructional impact of students missing 10% or more of the school year and asked the board to consider chronic absenteeism when planning interventions. - Local comparisons across the regional DERG showed Darien’s identification rate is among the highest, but all districts increased; staff described Wilton’s summer SRBI program as an example worth studying further.
Staff recommendations and board directions: Presenters recommended district actions including calibration of eligibility determinations across buildings, deeper building‑level case study reviews, alignment of MTSS and special‑education teams, clearer timelines for tier entrance/exit and improved ongoing data collection so trends can be monitored. The board requested follow‑up information and next steps: - Staff to provide the Connecticut state report card per‑pupil and special‑education expenditure data for DERG comparisons (requested by board member Greg). - Staff to report chronic absenteeism data at the secondary level as a comparison to the elementary trend. - The board requested an update on MTSS and related indicators early in the 2025‑26 school year (first quarter/November timeframe) and quarterly thereafter.
Board members pressed for specific timelines and asked how the district will measure intervention effectiveness and the “return” from intensive short‑term interventions versus slower, long‑term approaches. Staff said that the next step is building‑level analysis and working with MTSS teams to set clear entrance/exit timelines, measurement points and professional learning supporting fidelity. The board did not vote on policy changes at the meeting but directed staff to return with the requested data and an implementation/reporting plan.