Get Full Government Meeting Transcripts, Videos, & Alerts Forever!
Get email alerts on the Water Quality topic
No spam. Unsubscribe anytime.
York County says USGS monitoring shows lower sediment, nitrogen and phosphorus levels than 2019 DEP report
Summary
York County officials announced on Earth Day that four years of continuous monitoring conducted with the United States Geological Survey show county waterways carry substantially lower levels of sediment, nitrogen and phosphorus than a 2019 Pennsylvania Department of Environmental Protection report indicated.
York County officials announced on Earth Day that four years of continuous monitoring conducted with the United States Geological Survey show county waterways carry substantially lower levels of sediment, nitrogen and phosphorus than a 2019 Pennsylvania Department of Environmental Protection report indicated.
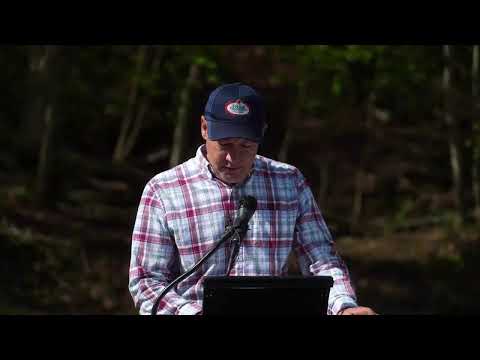
County Commission President Commissioner Wheeler made the announcement at a news event on Fishing Creek in Goldsboro, Newberry Township, and credited a county–USGS partnership that established six monitoring stations along the county's eastern boundary.
The monitoring system, the county said, records measurements every 15 minutes at each station and has produced a four‑year dataset the county used to compare with DEP's 2019 modeled estimates. "That's 96 data points every day, 365 days a year," Wade Gohbrecht, director of the York County Planning Commission, said as he described the monitoring cadence and the results.
Gohbrecht presented the county's four‑year averages alongside DEP's 2019 modeled figures. According to the county: the 2019 DEP model estimated about 957,000,000 pounds of sediment originating in York County, while the county's USGS monitoring produced a four‑year average of roughly 106,000,000 pounds. For nitrogen, the DEP figure cited at the event was nearly 12,000,000 pounds versus a county four‑year average of about 7,200,000 pounds. For phosphorus, the county reported a four‑year average near 370,000 pounds compared with about 447,000 pounds in the DEP model.
Those comparisons were presented by Gohbrecht and described at the event as model‑to‑measurement differences; the county characterized the DEP estimates as derived from computer modelling rather than continuous field monitoring. "Now that we have an accurate picture of water quality, we now also know that our pollutant levels are considerably lower than what DEP had reported," President Commissioner Wheeler said.
Speakers at the event emphasized that the findings do not end county efforts to improve water quality. The county said it is in year five of a planned 10‑year monitoring program and that partners including the Susquehanna River Basin Commission, the York County Farm Bureau and the York County Conservation District will work with the county to target improvements. "If there's something we're doing well, then perhaps it can be replicated elsewhere," Baron Shaw, president of the York County Farm Bureau, said.
Andrew Dayhoff, executive director of the Susquehanna River Basin Commission, described the monitoring as a useful complement to modeling and wider regional planning: "If there's one thing that resource managers always welcome, it is more and better data," Dayhoff said, and he praised the county's investment and the USGS role in the project.
County officials also described watershed differences revealed by the monitors. At the event the county said the Fishing Creek watershed contributed about 32% more sediment per square mile than other watersheds in the county and that the Muddy Creek watershed had the highest nitrogen loads but the lowest phosphorus loads compared with other county watersheds. The county noted that the Conservation District processed more than 360 permit applications and performed 819 site visits last year as part of on‑the‑ground efforts to limit erosion and runoff.
The county made the monitoring data publicly available through a USGS‑built dashboard at www.yorkcountywqm.org and said the data are intended to help refine models, target conservation practices and track long‑term trends. Officials at the event cautioned that the DEP numbers discussed were model estimates from 2019 and framed the USGS measurements as providing additional, site‑specific evidence to guide local work.
No formal policy changes or votes were recorded at the event; speakers described the announcement as a data release and a status update on an ongoing monitoring program. County officials said the program will continue and that stakeholders will use the data to inform future decisions about restoration and permitting.
The event closed with recognition of partners and staff who helped build the monitoring program and with a reminder that the work will continue through the county's 10‑year monitoring commitment.