Get Full Government Meeting Transcripts, Videos, & Alerts Forever!
Get email alerts on the Safe Routes To School topic
No spam. Unsubscribe anytime.
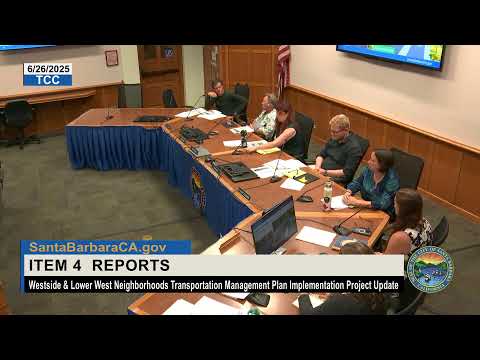
Santa Barbara staff present Safe Routes to School survey showing safety concerns, limited response
Summary
City of Santa Barbara staff presented results of a Safe Routes to School survey as part of a federally funded Safe Streets for All planning grant, reporting 311 parent responses across 19 city schools and identifying driver behavior and parking trade-offs as top safety concerns.
City of Santa Barbara staff presented results of a Safe Routes to School survey on June (date not specified), part of the city’s federally funded Safe Streets for All planning effort, saying the responses will inform upcoming chapters of the city’s safety action plan.
Chelsea Swanson, project planner, told the Transportation and Circulation Committee that the survey was developed with outside technical partners and administered in English and Spanish via ParentSquare in November–December 2024 and again in January 2025. "The overall goal of the plan is to prevent traffic-related fatalities and serious injuries within the city while increasing safe, healthy, and equitable mobility for all," Swanson said.
The nut of the presentation: staff received 311 responses from parents representing every school inside city limits (19 schools). Responses were uneven by school (the range was one response at the low end up to 36 at the high end), and staff cautioned the results are not a statistically representative sample of all students but provide a cross-section of concerns to guide next steps.
Survey highlights staff emphasized: - Respondents identified transportation safety as their top neighborhood challenge when asked to rank issues. Driver behavior was the most-cited immediate safety threat: "people driving sometimes speed and/or ignore traffic signals and stop signs," followed by bicyclists not always obeying signals and pedestrians sometimes not looking before crossing. - Mode share among respondents: about 37% said children usually travel to school by car, 22% by walking and 16% by biking or e-bike (combined). - On a question about reducing on-street parking to add pedestrian or bicycle facilities, roughly a majority (about 54%) said they would support removing some parking to improve safety.
Swanson said the survey was developed in collaboration with "Cow Walks" (as recorded in the meeting materials) and UC Berkeley’s Safe Transportation Research and Education Center (SafeTREC). The survey was distributed districtwide through ParentSquare; staff noted the districtwide distribution led to some responses from schools outside the city limits. The survey instrument and full results are in meeting attachments, she said.
Committee members pressed staff on response rate and outreach. Committee member Bickford and others said the 311 responses were a small share of the population and asked how to increase future participation. Swanson and staff described several planned outreach adjustments for the next engagement round, including in-person tabling at schools, targeted school-level follow-ups, timed distribution to avoid the winter break period, and possible student surveys for older grades (which staff said raised additional legal and procedural requirements that they will explore).
Members also asked about enforcement and education. Staff said enforcement remains an important part of the city’s approach and that police and fire will be involved as the project moves from analysis into the approaches chapter; a Grand Jury report on e-bikes was also noted as under review and will receive a formal city response.
Public comment came from Barry Remus of Move Santa Barbara County, who said Move supported the grant and encouraged the city to use the survey data to prioritize crossings, separated bike lanes and traffic calming near schools. "If parents would feel more comfortable letting their children walk to and from school, we don't forget the trip back, rather than having to be driven, if there were more marked crossings or rapid flashing beacons or pedestrian refuge islands or separated bikeways," Remus said.
Next steps: staff said the citywide component of the Safe Streets survey remains open through June 30 (may be extended) and that staff will combine school and citywide results, cross-reference collision data and begin proposing safety countermeasures this summer. Staff expects a follow-up touchpoint in the fall to share what was heard and possible school-level project ideas. The overall Safe Streets for All planning grant is a two-year effort; staff said the final safety action plan is targeted for City Council in June 2026 and must be completed by September 2026.
Clarifying details from the presentation include the federally funded grant size ("almost $800,000" with a 20% city match), 311 survey responses covering 19 city schools, per-school response range (1–36), and the approximate survey mode-share and willingness-to-trade-parking statistics cited above. Staff repeatedly cautioned that the respondent pool is not a census and that lower-response schools will receive targeted outreach.
The committee provided detailed feedback on outreach tactics (timing, paper distribution/QR codes, outreach through school principals and PE teachers, and targeted student surveys for older grades) and encouraged coordination with the police department on enforcement strategies as the plan develops.