Advisory board narrows public summary to four graphics, orders ZIP‑level data scrub
Loading...
Summary
Advisory board members and staff on Nov. 6 reviewed a Power BI‑generated report summarizing complaints and blast (PPV) readings from the Miami‑Dade pilot program and directed staff to produce a simplified, single‑page public cover and a set of more detailed internal pages.
Advisory board members and staff on Nov. 6 reviewed a Power BI‑generated report summarizing complaints and blast (peak particle velocity, PPV) readings from the Miami‑Dade pilot program and directed staff to produce a simplified, single‑page public cover and a set of more detailed internal pages.
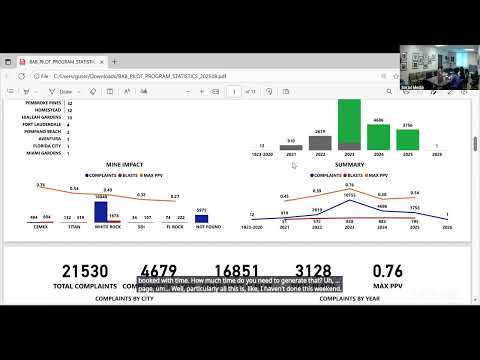
The board concluded the cover should include four graphics: total complaints across the dataset, total blasts and blasts by year (showing average and maximum PPV), a PPV‑range distribution with corrected decimal formatting, and a municipality breakdown with cleaned ZIP‑to‑city mapping. Members emphasized the public cover must be “cut and dry” so casual viewers do not misread technical charts.
Why this matters: the report aggregates roughly 22,000–23,000 complaints across multiple years and links those complaints to seismograph readings and mine operators. Board members said the headline totals and per‑mine impact comparisons are the clearest evidence for outreach to municipalities and state lawmakers, but they warned that misclassified addresses and visualization errors could create confusion or be labeled misleading if published without correction.
Key data issues and required fixes - Misclassified place names: staff and board members identified multiple examples where addresses were attributed to incorrect municipalities (examples discussed: Hialeah, Miami Lakes, Palm Springs North, Miramar, Hollywood and unincorporated Miami‑Dade). The board instructed staff to scrub records by ZIP code and reassign ambiguous ZIPs (for example, 33015 and 33018) into the correct buckets (city, unincorporated Dade, Miami Lakes or Palm Springs North) before publishing municipality totals. - "Not found" / missing PPV values: several complaints are not linked to a measured PPV or to a specific blast event; the board asked staff to investigate whether those are untriggered monitors, older records, or incomplete submissions and to relabel the visual with clear language such as “no PPV data reported.” - Decimal/axis errors: a PPV chart had misplaced decimals in the visual (values appearing as 3 where they should be 0.3 or 0.76). Members required fixes to axis labels and legend colors to prevent misinterpretation. - Granularity and cadence: the city‑level bucket requires manual vetting and will be updated on a quarterly basis rather than every monthly refresh to ensure accuracy; other automated charts may remain on the standard refresh schedule.
Decisions, assignments and timeline - Cover composition: the board approved a one‑page public cover containing four items — total complaints, total blasts by year (average and max), PPV distribution with corrected formatting, and complaints by municipality — plus deeper, city‑specific inside pages for stakeholders. - Data cleaning: staff (lead: Miguel) will produce corrected visuals that fix decimal placement, relabel “not found” entries, and prepare a draft of revised municipality buckets. Edwin and Francesca will assist with ZIP‑to‑city mapping logic and the cover page layout/letterhead for external use. Steven agreed to review regional grouping logic and the mine‑impact chart. - Delivery schedule: revised visuals and a draft cover were requested for the week of Nov. 11–14, with feedback due back by Friday of that week and a target follow‑up review the week of Nov. 17. The working target for final approval and print/web publication is the board’s Nov. 20 meeting.
Next steps and follow up: staff will provide an updated Power BI export (corrected charts and a JPEG of the cover graphics) and a short memo explaining how ambiguous addresses were reclassified. The board asked staff to include a short explanation on the cover that the pilot dataset is current through Sept. 10 and to call out any records that remain uncategorizable.
The meeting ended after a motion to adjourn was made and seconded; the motion carried by voice vote (ayes recorded).