Get Full Government Meeting Transcripts, Videos, & Alerts Forever!
Advisory board narrows public summary to four graphics, orders ZIP‑level data scrub
Summary
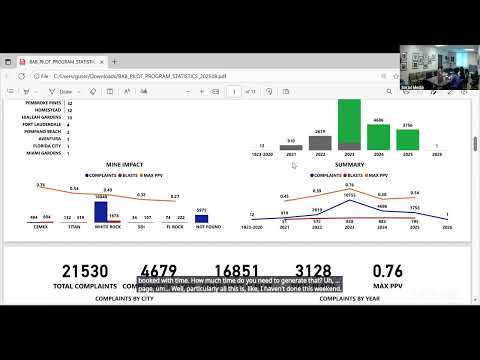
Advisory board members and staff on Nov. 6 reviewed a Power BI‑generated report summarizing complaints and blast (PPV) readings from the Miami‑Dade pilot program and directed staff to produce a simplified, single‑page public cover and a set of more detailed internal pages.
Advisory board members and staff on Nov. 6 reviewed a Power BI‑generated report summarizing complaints and blast (peak particle velocity, PPV) readings from the Miami‑Dade pilot program and directed staff to produce a simplified, single‑page public cover and a set of more detailed internal pages.
The board concluded the cover should include four graphics: total complaints across the dataset, total blasts and blasts by year (showing average and maximum PPV), a PPV‑range distribution with corrected decimal formatting, and a municipality breakdown with cleaned ZIP‑to‑city mapping. Members emphasized the public cover must be “cut and dry” so casual viewers do not misread technical charts.
Why this matters: the report aggregates roughly 22,000–23,000 complaints across multiple years and links those complaints to seismograph readings and mine operators. Board members said the headline totals and per‑mine impact comparisons are the clearest evidence for outreach to…
Already have an account? Log in
Subscribe to keep reading
Unlock the rest of this article — and every article on Citizen Portal.
- Unlimited articles
- AI-powered breakdowns of topics, speakers, decisions, and budgets
- Instant alerts when your location has a new meeting
- Follow topics and more locations
- 1,000 AI Insights / month, plus AI Chat