Get Full Government Meeting Transcripts, Videos, & Alerts Forever!
Get email alerts on the Education Assessment topic
No spam. Unsubscribe anytime.
Hopewell Valley board reviews 2025 NJGPA results; overall proficiency high, subgroup gaps persist
Summary
District presenters told the Hopewell Valley Regional School District board that 94% of juniors met the NJGPA benchmark in ELA and 86% in math, while noting that small subgroup sizes make year-to-year shifts volatile and that the district will pursue deeper analyses of disparities and supports.
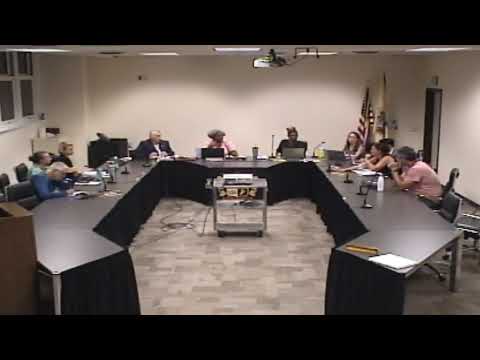
At a regularly scheduled meeting, a district data presenter reviewed the 2025 New Jersey Graduation Proficiency Assessment results for the Hopewell Valley Regional School District, saying, “Overall, 94 percent of students are graduation ready in ELA and 86 percent math.” The presentation included multi‑year trend charts, subgroup disaggregation by race, gender and program participation, and comparisons with statewide averages where HVRSD students consistently outperformed the state.
Board members pressed the presenter on what “graduation ready” means for 11th graders and how the district should interpret volatile percentage changes in small subgroups. The presenter clarified that the NJGPA benchmark is set for grade 11 and that the state provides alternative pathways to graduation, such as qualifying scores on other standardized tests or a portfolio appeal, for students who do not meet the benchmark.
Several trustees urged caution about reading a single year of gains as durable. One member said they would “start celebrating in two years” if improvements hold. Administrators agreed to add deeper analyses to future reports, including: (1) whether students who entered the district later perform differently from those continuously enrolled, (2) program‑level outcomes for special education and economically disadvantaged subgroups, and (3) the role of culturally responsive instruction and social‑emotional supports.
The presenter and principal noted that small subgroup counts can inflate percentage swings and that some tables in the packet already show n (tested) for each bar chart; board members asked staff to make the base counts clearer in public materials. The district said it will include additional breakdowns and follow up on concerns about student stress tied to graduation messaging.
Next steps include a deeper programmatic dive and sharing more granular tables with the board and public; administrators said they will report back in a future meeting with the requested subgroup and cohort analyses.