Get Full Government Meeting Transcripts, Videos, & Alerts Forever!
Get email alerts on the Academic Performance topic
No spam. Unsubscribe anytime.
Tempe Union presents assessment results: semester 1 failure rates below 10 percent, administrators flag sophomore cohort for focus
Summary
District assessment staff told the board most common final exams show reliability above 0.75 and that districtwide semester 1 failure rates across courses were below 10 percent; the presentation highlighted higher failure rates among English learners and some special education subgroups and noted the district is developing placement-level reporting.
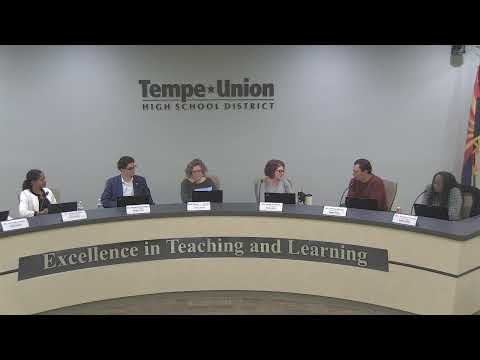
At the Jan. 18 governing board meeting, district assessment staff presented a district-level overview of academic performance and attendance, describing the assessment continuum, development of common final exams, and tools principals use to target interventions.
Presenter (identified in the transcript as Doctor Alexik) explained the district’s balanced-assessment approach, which includes daily classroom measures, unit assessments, common district final exams and annual summative assessments. He said common final exams are created by teacher cadres, undergo item analysis and have reported reliability values generally greater than 0.75. The presenter reported correlations between final exam scores and final course grades of approximately 0.65–0.75.
Using semester 1 district data, the presenter said the combined rate of course failures across core and noncore classes was below 10 percent. He noted variation by cohort and subgroup: sophomores emerged as a cohort with higher failure and discipline rates; English language learners and some racial/ethnic subgroups (American Indian, African American, Native Hawaiian/Pacific Islander) showed higher failure rates; economically disadvantaged students had higher failure rates than their peers; and students in special education had higher failure rates though still below 10 percent overall.
The presentation included examples of item analysis and how cadres revise or remove items with low discrimination. The presenter said cadres set proficiency cut scores; for example, the new Algebra 2 exam used a proficiency cut of 65 percent in its setting. Board members asked whether the district can produce subject-specific (ELA, math, science) and placement-level breakdowns. The presenter said those views are available in the district dashboard and that staff are working to pull placement-level data from the student information system (Synergy).
Attendance update
The presenter reported semester 1 attendance rates at or above the district goal of 90 percent for each school (noting that 2024 figures are semester 1 only and 2023 figures are based on a full year). He said Fridays show the highest absence rates and Mondays are the second-highest; principals and MTSS teams are using the dashboard to create individualized intervention plans for students below the 90 percent threshold.
Board requests and follow-up
Board members asked for disaggregated reports that isolate core-subject performance and placement-level special education splits (modified/alternate assessments versus general education assessments); the presenter acknowledged a data-pull ticket is in process to provide placement-level reporting. Members also requested examples of successful school strategies that produced higher proficiency at specific campuses; the presenter noted collaboration opportunities and invited follow-up to explore successful interventions.
The board received the presentation and asked staff to return with additional disaggregated views and with examples of school-level strategies in future briefings.