Get Full Government Meeting Transcripts, Videos, & Alerts Forever!
Get email alerts on the Climate Inventory topic
No spam. Unsubscribe anytime.
San Francisco's 2022 greenhouse gas inventory shows emissions roughly steady; city highlights progress and barriers to CAP implementation
Summary
City staff told the Commission the 2022 inventory shows 4,120,000 metric tons CO2e (about 48% below the 1990 baseline) and a net stabilization since 2020. Staff highlighted sector trends, 89% renewable electricity in 2022, and implementation barriers for the 2021 Climate Action Plan including funding and staffing.
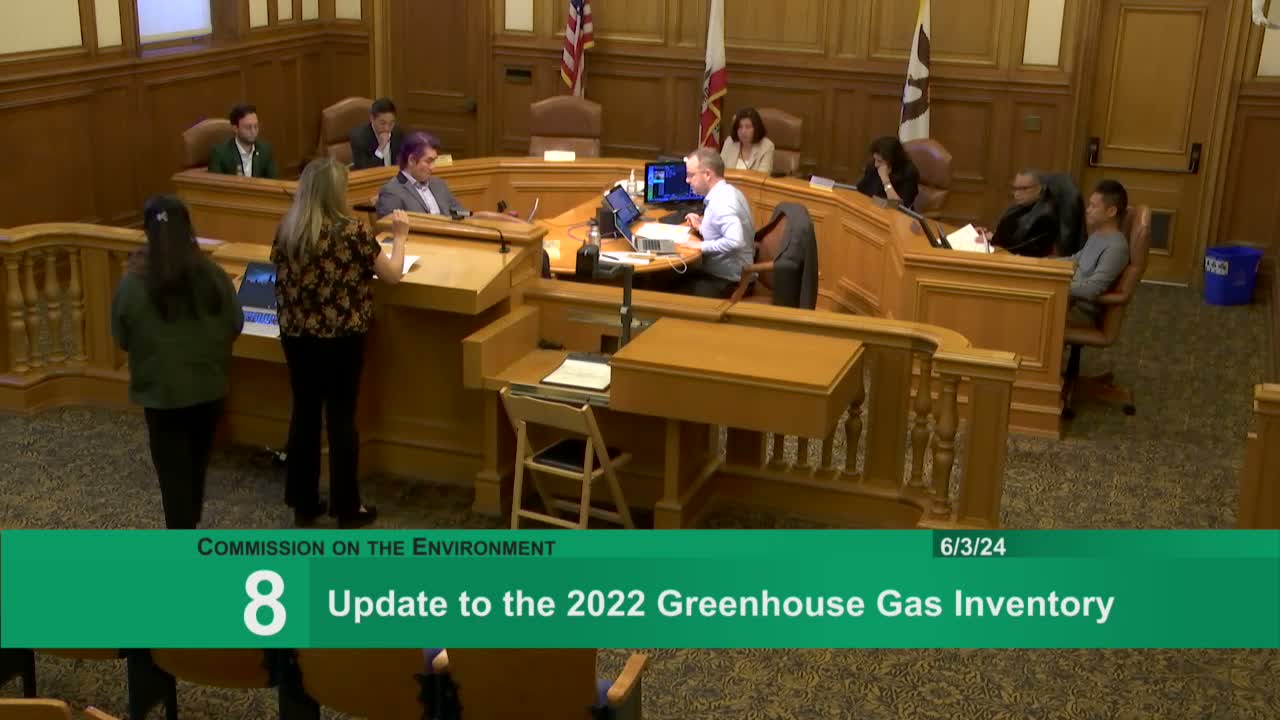
San Francisco's Department of the Environment reported on June 3 that the city produced 4,120,000 metric tons of carbon dioxide equivalent in 2022, a level the department said represents about a 48% reduction from its 1990 baseline and is essentially unchanged from 2020, indicating stabilization as the city recovered from the pandemic.
Stephanie Lee, Climate Program Assistant Coordinator, presented the inventory results and broke down emissions by sector: transportation and buildings remain the largest contributors, followed by landfill organics and municipal operations. Lee told commissioners municipal emissions rose about 3% compared with 2020, driven largely by natural gas use in municipal buildings. She added that electricity emissions declined and that the city reached approximately 89% renewable electricity in 2022.
"The total emissions that we generated as a city in 2022 was 4,120,000 metric tons of carbon dioxide equivalent," Lee said. "This is about a 48% reduction compared to our 1990 baseline levels."
Staff also highlighted a 27% reduction in landfill-organics emissions compared with 2020 and a 65% reduction in per-capita landfill emissions since 1990. The presentation explained that municipal building emissions are dominated by natural gas consumption and that public-transit energy use is reported via agency-supplied consumption data.
Commissioners asked technical questions about occupancy, vehicle-mile calculations and comparability to other years. Lee and Climate Program Manager Cindy Comerford said the inventory uses direct energy-consumption data for buildings and agency-provided energy or fuel consumption for transit; private-vehicle emissions rely on modeled vehicle miles traveled.
Comerford and Sylvain Lutewigt (Climate Program Assistant Coordinator) also presented a CAP progress report and dashboard that tracks 175 action items from the 2021 Climate Action Plan. Departments reported as of the end of 2023 that 10% of actions are complete, 42% are on track, 11% are delayed and 6% face major barriers. Staff identified funding constraints, staffing shortages, and procurement delays as primary implementation challenges and said they plan a CAP update in 2025 that will include a wedge analysis and refined targets.
Staff asked for commissioners' help in identifying funding and political support to close gaps; commissioners offered to coordinate advocacy and letters to city leadership where appropriate. Staff said they will return in the fall with analysis and proposed adjustments for the 2025 CAP update.
Next steps: staff will analyze the 2022 findings, perform the planned wedge analysis, and present recommended CAP updates to the commission in the fall of 2024 for feedback.