Get Full Government Meeting Transcripts, Videos, & Alerts Forever!
Get email alerts on the Climate Action Plan topic
No spam. Unsubscribe anytime.
Environment Department unveils Climate Action Plan dashboard and posts water‑supply chapter
Summary
Staff presented a CAP update: a new water‑supply sector added, delayed 2020 GHG inventory (staffing and COVID caveats) showing 48% below 1990 levels in 2020, and a public dashboard with 19 indicators tied to CAP strategies to track implementation and outreach results.
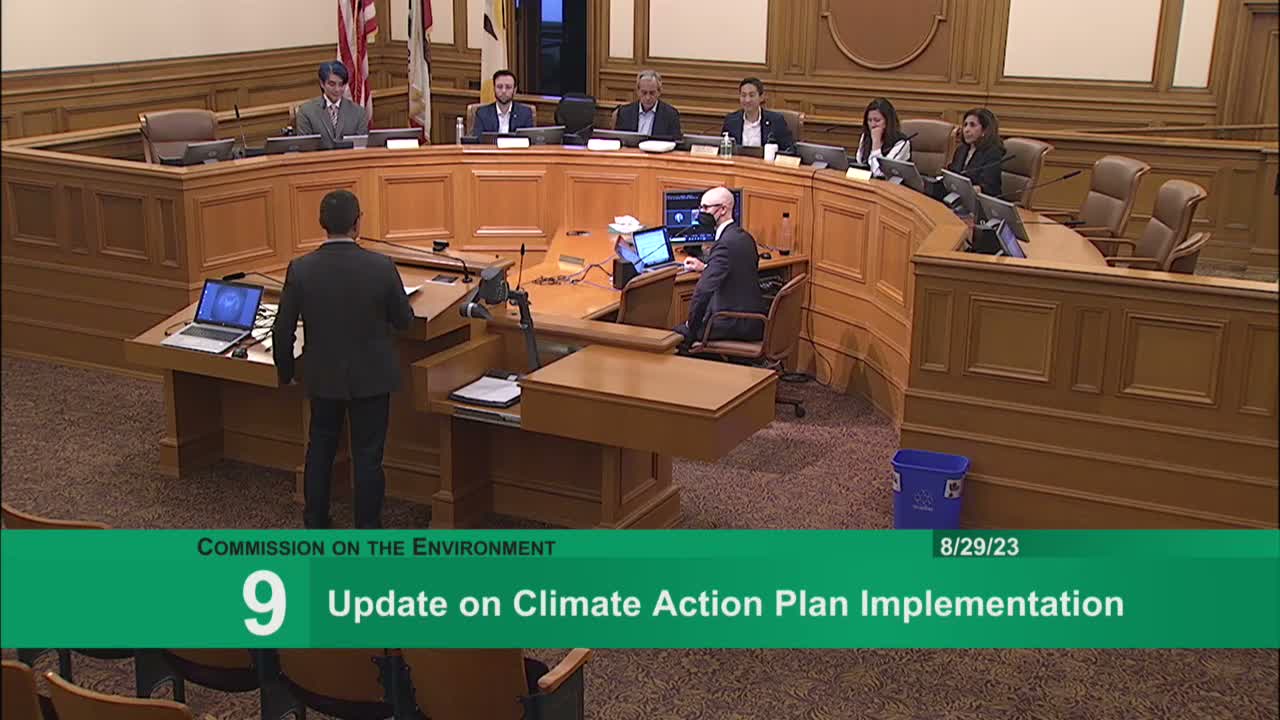
The Environment Department presented an update on the 2021 Climate Action Plan (CAP) implementation on Aug. 29, including a new water‑supply sector, progress on greenhouse‑gas inventories and the launch of a public dashboard to track indicators tied to CAP strategies.
Rich Chen, senior environmental specialist, said the CAP was expanded to include a water‑supply chapter developed with the San Francisco Public Utilities Commission and that an addendum would post on the CAP website. He explained delays in publishing the 2020 greenhouse‑gas inventory were caused by staff turnover and COVID‑era data challenges; data show the city’s 2020 emissions were about 48% below 1990 levels and about 12% below 2019 levels, caveated by pandemic impacts on travel and activity.
Chen demonstrated the new public dashboard (sfclimateplan.org), which includes an ‘implementation snapshot’ summarizing departmental actions, and 19 indicators for 31 CAP strategies. The dashboard documents recent achievements, tracks indicators such as renewable electricity share, and includes pre/post campaign survey results that show awareness of climate messages rose from 12% to 31% among respondents amid broader news coverage.
Commissioners recommended clearer display of goals and dates for each indicator to make it easier to see where the city meets or misses targets. Staff said they will refine the metrics and refresh the dashboard annually as departments provide updated data.