Get Full Government Meeting Transcripts, Videos, & Alerts Forever!
Get email alerts on the Campaign Finance Data topic
No spam. Unsubscribe anytime.
SFSU students preview interactive 2014 campaign-finance visualization showing $25M in November spending
Summary
San Francisco State graduate students showed an interactive Tableau visualization of November 2014 campaign finance records, reporting about $25 million in November spending, with roughly $12 million in consultant expenditures driven largely by Measure E. The Ethics Commission praised the tool and asked staff about keeping it updated.
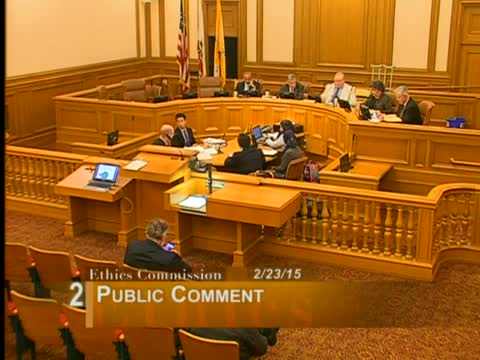
Students from San Francisco State University presented an interactive data-visualization preview of November 2014 campaign finance activity to the San Francisco Ethics Commission on Feb. 23. The project, built in Tableau and fed from the city's open-data portal, aggregates the full 2014 election cycle filings and allows users to explore contributors, consultants, PACs, lobbyist contacts and county central committee funding.
The students, Kristen Walsigle and Jeff Thorsby, said the tool shows nearly $25 million in spending in the November 2014 elections (not including the June primary), with about $22 million spent on positions that won and roughly $3 million on positions that lost. They reported that candidate committees spent over $7 million and that consultant expenditures accounted for about $12 million of the total. Presentation slides and the demo highlighted that consultant spending was heavily concentrated on ballot measures, and that Measure E activity dwarfed other measures in consultant dollars.
Commissioners and staff praised the work as a useful way to make complex public records accessible. Commissioner comments focused on the tool's potential to help the public and staff identify top contributors, outliers such as FC Pier 70 LLC and the American Beverage Association, and the geographic sources of funding for county central committees (the demo showed contributions from other states including Oregon, Colorado and Texas). The students and Steven Massey, the commission's information-technology officer, said the report will be embedded on the Ethics Commission website and, where possible, linked to the Open Data portal with OData so the visualization can be refreshed nearly nightly. They cautioned, however, that some consultant data are still entered manually and will remain a manual-maintenance point until filing processes change.
Members of the public and witnesses asked about standardizing employer/job-title fields and publishing donor residence data. Staff confirmed employer and job title fields exist in the database but are free-text fields that are not currently standardized, making some searches difficult; staff said standardization is possible but would require additional work. The presenters estimated the public version of the interactive visualization would go live in about two to three weeks.
The commission did not take formal action on the presentation itself but encouraged staff to continue integrating the tool with the Ethics Commission website and the city's Open Data portal. The presentation provided the commission and the public an early view of a searchable, drillable data set intended to clarify how money flowed through the 2014 local election cycle.