Get Full Government Meeting Transcripts, Videos, & Alerts Forever!
Get email alerts on the Public Opinion topic
No spam. Unsubscribe anytime.
Controller’s office presents 2019 City Survey showing homelessness and housing as top concerns; Muni ratings decline
Summary
Controller staff presented the 2019 City Survey (2,200+ responses) showing homelessness and housing as top issues, a decline in overall Muni ratings to C+, increased concerns about cleanliness, and that nearly three-quarters of respondents said homelessness is getting worse. Public commenters criticized Muni performance and the SFMTA responded with data on targeted improvements.
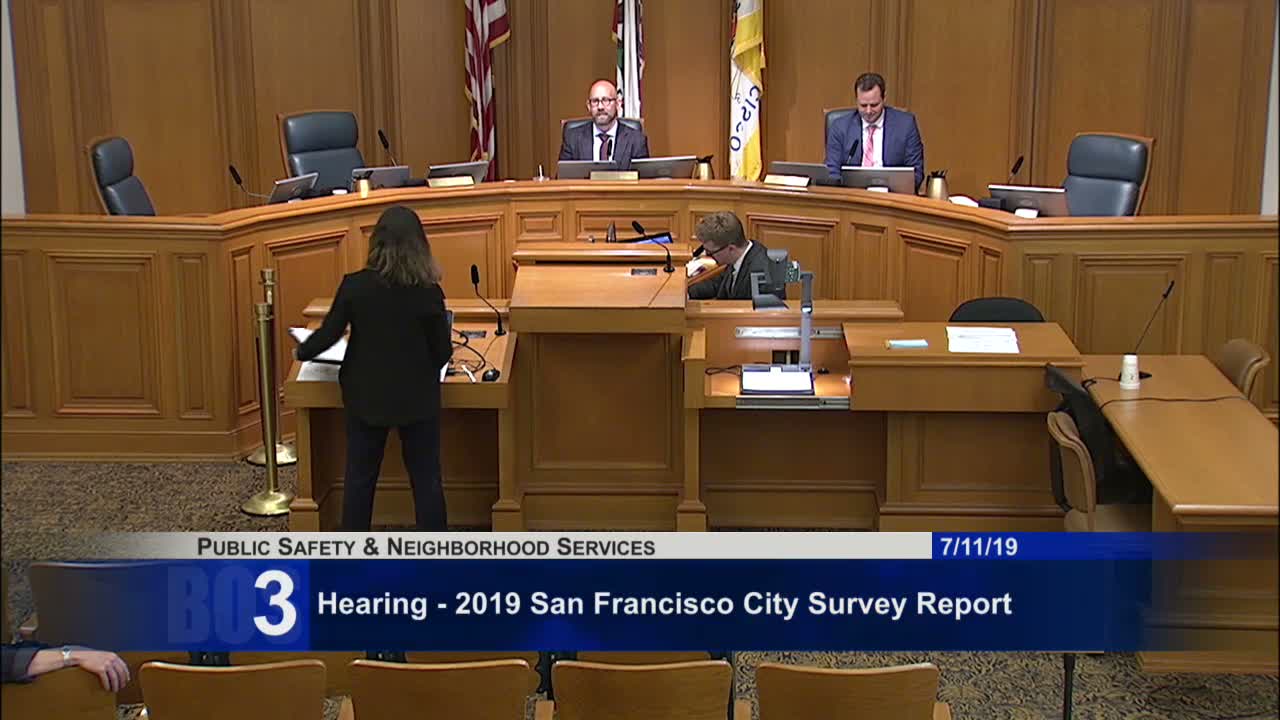
The Public Safety and Neighborhood Services Committee heard the Controller’s Office presentation of the 2019 San Francisco City Survey on July 11, which reported more than 2,200 completed interviews and highlighted homelessness and housing as the most-cited top issues.
Emily Lisker, a project manager in the Controller’s City Performance Unit, said the survey is the seventeenth iteration and was fielded from late November 2018 through February 2019. Respondents rate services on an A–F letter-grade scale; the offices presented both letter grades and the percent of respondents who rated services A or B. Lisker said government overall has remained a B-minus since 2013. The survey shows transportation and infrastructure peaked in 2017 and dropped in 2019, and nearly three quarters of respondents said homelessness has gotten worse since 2017. More than half of respondents said street cleanliness has worsened, and roughly half reported public safety is getting worse.
Glennis Starks, Senior Performance Analyst, reviewed service-area results. She said Muni’s composite grade fell to a C+ this cycle, although some subattributes—such as driver courtesy—improved. "For example, in 2019, 40% of all respondents rated Muni A or B," she said, explaining how percent-A/B can differ from the aggregated letter grade because the grade reflects the full A–F distribution.
Committee members questioned the methodology and asked whether distribution effects could explain differences between percent-A/B and letter grades. Staff said the grade is derived from the full distribution of A–F responses and that the percent-A/B is provided as a more accessible communication metric; staff also said they would publish interactive district-level dashboards and pursue follow-up analyses linking perception data with departmental operational metrics.
During public comment, Eileen Bogan of the Coalition for San Francisco Neighborhoods criticized Muni, saying transportation is the lowest-rated service and listing incidents including harassment allegations, a serious injury and a construction death in the Twin Peaks Tunnel, and an LRV smoke event. "The MTA states that it is learning from its mistakes," Bogan said, urging stronger accountability rather than relying on increased spending. Mr. Ramos, speaking for the SFMTA, thanked the committee and noted the agency's own surveys show correlation with the city survey; he cited MuniForward investments and examples of improvement, saying, "The 5 Fulton went from 13% crowding ... to 2% crowding," as evidence that targeted changes can reduce crowding and improve service.
Chair Rafael Mandelman closed the hearing and the committee took the presentation 'heard and filed.' Staff said they will publish more detailed, district-level materials and continue engaging departments to connect the survey results to operational data and program-level surveys.