Get Full Government Meeting Transcripts, Videos, & Alerts Forever!
Get email alerts on the Education Adequacy topic
No spam. Unsubscribe anytime.
WestEd and APA tell Arkansas education committee: funding differences alone don’t close gaps in proficiency
Summary
APA and WestEd presented an equity and adequacy study to the Senate Education Committee showing persistent achievement gaps by income, race and student needs; presenters said per-pupil funding differences in Arkansas did not show a strong positive relationship with ACT Aspire proficiency and that case studies and targeted interventions will be brought back.
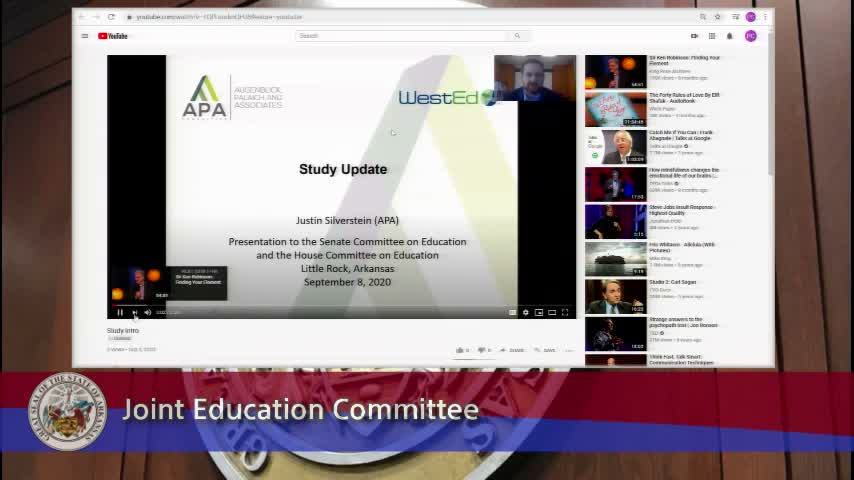
Justin Silverstein, an analyst with APA, told the Senate Education Committee the multi-part adequacy study will combine statewide data analysis, district surveys and case studies and invited public participation: “We have a stakeholder survey…It’s going to be open through the eighteenth,” he said.
Researchers from WestEd presented the core findings. Raifu Duverdoyier Jr., a research associate at WestEd, said disadvantaged groups — low‑income students, limited‑English‑proficient students, students with disabilities and many students of color — had lower proficiency and growth on the ACT Aspire in the years analyzed. “Students of color all have lower proficiency rates than their peers,” Duverdoyier said, summarizing a state‑level pattern the team found.
The presenters gave specific measures from the study’s 2016–2019 window: statewide proficiency on the ACT Aspire was 43.7% in ELA and 46.6% in math in 2019; students with disabilities posted especially low proficiency (about 12.2% in math and 7.2% in ELA). The study also reported per‑pupil spending differences by student group in 2018, with per‑pupil funding generally ranging roughly from $9,817 to $10,695 and a median per‑pupil amount near $9,483.
On the relationship between funding and student outcomes, WestEd staff presented descriptive and regression analyses (ordinal logistic regression and LASSO) and cautioned the work is observational. Their conclusion was that, in Arkansas data from the years studied, higher per‑pupil funding did not translate into clear, substantive gains in ACT Aspire math or ELA: “per pupil funding does not seem to have a strong relationship with performance,” the presenters reported.
Patrick McClellan of WestEd summarized the team’s concentration‑of‑poverty analysis, reporting remote and rural elementary schools frequently had the highest poverty rates (some remote elementary schools showed 75–80% low‑income students). He noted that a student’s own low‑income status was a stronger predictor of outcomes than the school‑level concentration of poverty, though concentrations were also negatively correlated with proficiency and growth.
Committee members pressed presenters on the limits of observational analysis and the absence of many out‑of‑school or student‑level family variables. Senator Elliott argued that closing achievement gaps will require work beyond the education committee’s jurisdiction and referred to housing and other social supports as relevant: “We cannot address housing in this committee,” he said. Presenters agreed the current slides focus on outcomes and in‑school factors but said follow‑up materials will include case studies and evidence on interventions and how other states structure supports.
Several legislators asked whether free‑and‑reduced‑price‑lunch status (the ADE low‑income proxy used in the analysis) misstates poverty in Arkansas and how that affects interpretation. WestEd acknowledged the limitations and said the free/reduced lunch metric was the most robust available state demographic in the ADE data the team used, but that cost‑of‑living differences and other measurement issues complicate national comparisons.
On class size and teacher workforce, WestEd reported average class sizes in 2018 were about 18.5 in elementary, 17.1 in middle and roughly 12 in high school; in Arkansas the constrained range of class sizes and confounding demographic patterns meant class size explained little of the variance in value‑added growth after controls were applied. The presenters said teacher experience, prior growth and other school/district variables explained more variation than marginal class‑size differences in the years studied.
The committee asked for more targeted follow‑up: members requested case studies, comparisons with other states, and analyses focused on younger grades (K–3) where research suggests class size can matter more. Presenters said they will return with case studies and literature on effective uses of poverty funds, plus additional analytic approaches if the committee requests them.
The committee set the next meeting to continue follow‑up work and adjourned.
Sources and evidence for this article are the presentations and Q&A recorded in the Senate Education Committee transcript of the meeting.