Get Full Government Meeting Transcripts, Videos, & Alerts Forever!
Get email alerts on the Resource Allocation topic
No spam. Unsubscribe anytime.
Senate Education Committee reviews resource allocation report; Bureau flags technology funding shortfalls and pandemic broadband gaps
Summary
Bureau presenter Julie Holt told the committee that foundation funding covered under the matrix did not fully meet technology needs from foundation dollars alone and that district surveys during the COVID period revealed significant device and community‑broadband gaps; members asked for maps, vendor detail and breakdowns of extra‑duty spending.
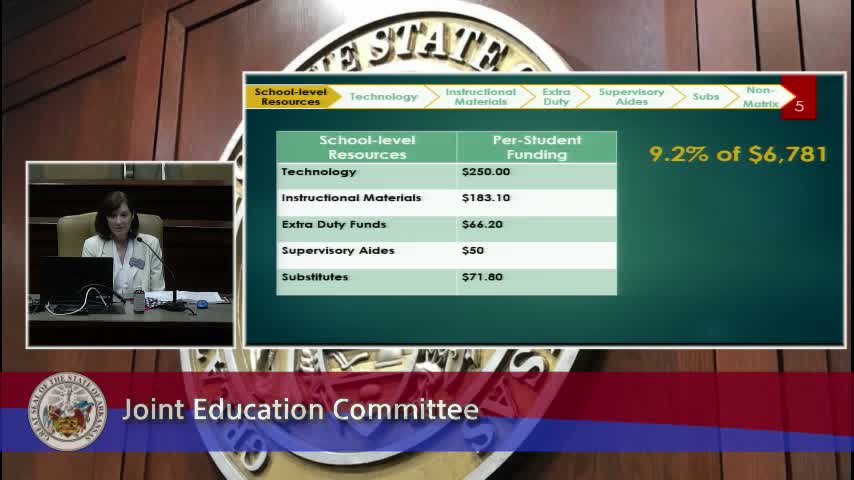
Julie Holt of the Bureau of Legislative Research presented the school‑level resource allocation report and the results of an April–May superintendent survey on pandemic technology needs. Holt said the technology line in the matrix provided $2.50 per student (about $119 million for 2018–19), but districts spent roughly $49 million of that out of foundation funds—about 45¢ of each foundation dollar provided for technology. When other sources (federal funds and ESA dollars) are included, per‑pupil spending reaches or slightly exceeds the matrix level.
Holt highlighted widening equity concerns that the pandemic exposed: only 17% of respondents reported that all students could take devices home, many districts reported devices are primarily shared, and community broadband availability—not the school’s internal broadband—was commonly cited as the principal barrier to remote instruction. Holt described partnerships (DESE and the Department of Information Systems) that have reduced district broadband costs and cited Act 1280 (2013) requiring at least one digital course and a diploma annotation; digital enrollment grew from about 8,000 students historically to ~127,000 in 2018–19.
On expenditures, Holt reported that districts spent foundation dollars on many non‑matrix items (about $177 million in 2018–19), with instructional aids ($69.5M), other instructional supplies ($33M), and athletic/transportation supplies among the largest categories. Extra‑duty stipends (coaches and activity sponsors) were one line where districts routinely spent more than the matrix provided (about $3.31 spent for every $1 of foundation money allocated for that line). Holt also described variability across charters and districts: some charters substantially exceed the matrix on instructional materials, often routed to parent organizations.
Committee members asked for several follow‑ups: a breakdown of extra‑duty expenditures (coaching versus other sponsors), confirmation of where supervisory‑aid dollars are spent, substitute pay ranges and extremes, the extent and reason districts contract with vendors for course content, and mapping of where digital health courses and other digital offerings are being used statewide. Several members stressed the urban–rural broadband divide and requested teacher PD feedback and superintendent testimony in future briefings. Holt said the bureau can pursue deeper coding, provide maps from survey responses and collect additional detail if requested.
The committee took no formal votes; members closed by scheduling follow‑up tasks and adjourning.