Get Full Government Meeting Transcripts, Videos, & Alerts Forever!
Get email alerts on the School Finance topic
No spam. Unsubscribe anytime.
Uniform tax‑rate modeling shows modest state/local share shifts; some resource inputs remain uneven across wealth quintiles
Summary
APA showed the effect of a 1‑mill URT increase (roughly $49M statewide in 2018‑19) would slightly raise local shares and reduce state shares; analyses of teachers per 1,000 students, average salaries, AP and computer‑science participation, and extra‑instructional programs found modest variation across wealth quintiles with mixed patterns.
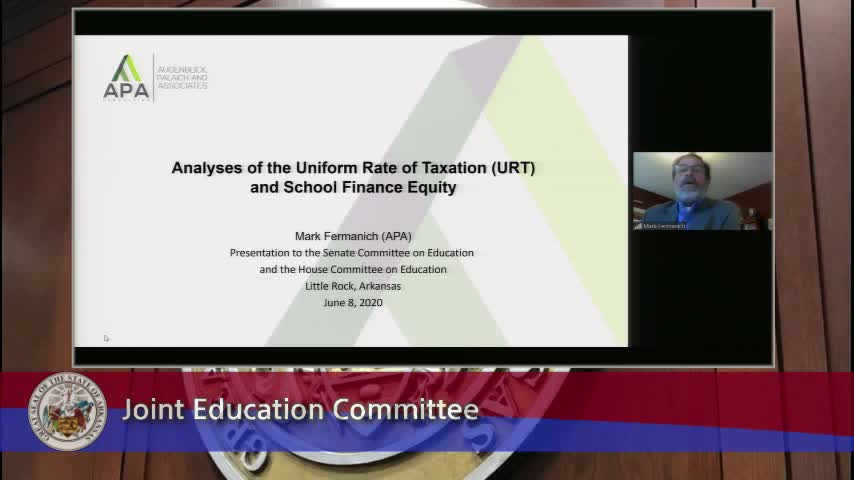
Mark Fermanek presented the APA analysis of the Uniform Rate of Taxation (URT) and an equity review of personnel and program resources across district wealth quintiles. He explained the URT is 25 mills and is used to compute the local share of the foundation funding amount; local voters can approve additional maintenance and operation (M&O) mills.
Modeling showed that a 1‑mill increase in the URT in 2018–19 would have raised about $49 million statewide and changed the statewide local/state share modestly (local share up from about 39.5% to about 41%). The per‑ADM local revenue effect of a 1‑mill change varies widely by district wealth: from roughly $14,000 per mill in the lowest‑wealth districts to about $3.8 million per mill in the highest‑wealth districts (reflecting differences in assessed value per pupil and district scale). Mark cautioned these differences reflect property‑wealth concentration and the distribution of additional mills.
On equity inputs, the presentation examined teachers per 1,000 students, administrators per 1,000, percent of teachers with master's degrees, average years of experience, and average classroom and administrator salaries, as well as program measures such as AP and computer‑science participation and the share of schools offering before/after/summer programs. Overall, coefficients of variation and correlation statistics suggested Arkansas has modest variation on many measures; in some recent years wealthier quintiles had higher teacher counts and higher average salaries, while the least‑wealthy quintiles sometimes showed higher average years of teacher experience and stronger disciplinary outcomes.
Committee members requested written explanations of the statistical measures and the quintile definitions; Mark said those details will be included in the final report and staff indicated they would provide the quintile wealth breakouts on request. The presenters emphasized they purposely did not replicate BLR’s full equity calculations and instead focused on resource‑input distribution to add to the bureau’s existing reporting.