Planning commission reviews 2025 build‑out analysis, previews AC 44 capacity tool
Loading...
Summary
Albemarle County staff presented a 2025 land‑use build‑out analysis and a draft AC 44 digital tool showing a county theoretical build‑out decline from just over ~24,000 units in 2022 to 21,644 in 2025; commissioners pressed for GIS linkage to schools, roads and sewer and asked staff to return to the Board of Supervisors on Jan. 21.
Albemarle County planners on Dec. 9 presented a new 2025 land‑use build‑out analysis and an early version of an “AC 44” capacity tool intended to track how current development proposals and approvals compare with the comp‑plan’s theoretical maximum densities.
JT Newberry, senior planner in the Department of Community Development, said the county’s theoretical maximum residential capacity declined from just over 24,000 units (the 2022 analysis) to 21,644 units in the 2025 update, a drop Newberry said is partly explained by units that were taken through the development pipeline and constructed and partly by changes in which parcels qualify as developable.
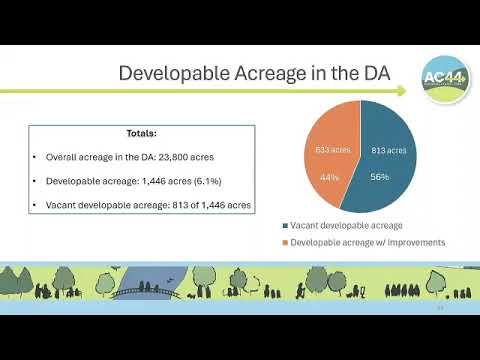
The presentation opened by defining terms used throughout the study: “developable” parcels (the staff rule used here was parcels of at least 2 acres that are vacant or whose land value exceeds improvement value), “redevelopable” parcels and the “theoretical maximum build‑out” — the maximum number of dwelling units a parcel could support under its comp‑plan designation. Newberry said the 2025 exercise intentionally replicated the 2022 methodology to allow apples‑to‑apples trend analysis while moving the underlying data from static reports to an Excel‑based, digital tool for quicker scenario testing.
Why it matters
Staff framed the product as a governance and monitoring tool tied to AC 44 and the comprehensive plan: it is intended to help the county administer growth‑management policy, compare approved densities to comp‑plan maxima, and summarize how many affordable units would be expected under a comp‑plan allocation versus what applicants actually propose. Newberry noted that, historically, approved project densities amounted to roughly 56–58% of comp‑plan maximums; excluding a large outlier (the North Fork rezoning that approved about 1,400 units) raised the approval rate to roughly 70% for the study period.
Commissioner concerns and requested refinements
Commissioners repeatedly asked staff to link the capacity tool spatially to other datasets. “Those parcels are analyzed without the context of where they’re located,” one commissioner said, urging overlay layers showing school capacity, road congestion, water/sewer availability, floodplain and steep slopes so the county can produce a heat map of where higher density is feasible. Commissioners also asked for redevelopment‑specific metrics (to distinguish greenfield vs. infill/redevelopment) and a county inventory of public parcels that could be used for workforce or social housing.
Several commissioners pressed staff for an ongoing tally: a rolling view that would show whether recent approvals are increasing or decreasing the county’s ability to meet comp‑plan capacity and affordable‑housing targets. Newberry said staff intends to incorporate market data from CoStar and to prepare the analysis and tool for a Board of Supervisors briefing on Jan. 21.
Staff cautioned that the analysis is a high‑level, “broad brush” tool; it removes environmental and infrastructure areas (floodplain, steep slopes, open space) from gross acreage to compute a theoretical net capacity and applies build‑out assumptions by land‑use designation. Newberry said the digital tool will make it easier to re‑run assumptions and to present both gross and net perspectives as AC 44 implementation proceeds.
Next steps
Staff will refine the draft AC 44 tool, test assumptions using CoStar and other market inputs, and present the analysis to the Board of Supervisors on Jan. 21. Commissioners asked staff to return with added GIS overlays (schools, road capacity, sewer/water service), redevelopment indicators (parking/impervious area, brownfields), and a proposed staff‑report format that includes rolling trend columns for affordable‑housing delivery.