WSSD reports strong fall MAP scores, highlights subgroup gaps and plans for targeted supports
Loading...
Summary
Wallingford‑Swarthmore SD presented fall 2025 NWEA MAP results showing district averages above national norms (first graders ~74th percentile) while identifying persistent achievement gaps for some student groups; district plans winter testing, MAP trainer workshops and targeted tiered supports.
The Educational Affairs Committee of the Wallingford‑Swarthmore School District heard a presentation Dec. 9 on fall 2025 NWEA MAP assessment results showing high overall achievement alongside persistent subgroup gaps.
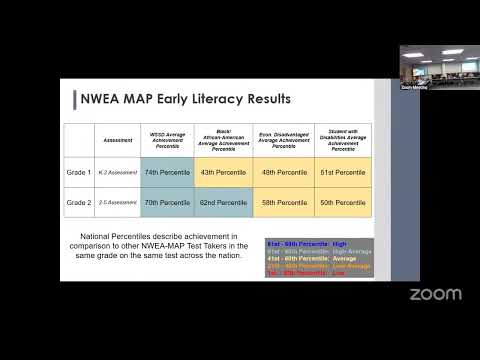
Dr. Pratt, the district presenter, told the committee that district averages for early grades place WSSD students well above national norms: "Our first graders scored higher than 74% of first grade students nationwide, and our second grade students scored higher than 70% of students nationwide on average," she said. She also cautioned that some subgroup scores cluster near the national median and that the district must act to disrupt those gaps.
The presentation explained that MAP scores are reported as percentiles — how a student performed relative to same‑grade peers who took the test in the same window — and use quintile groupings to visualize performance bands. Dr. Pratt drew attention to a data caveat: "This data for grade 2 doesn't include about 22 grade 2 students," she said, adding that those students are on the district's radar and will have an "on ramp" to participate in future independent reading assessments.
Board members asked how fall numbers compare with prior years and whether changes such as de‑leveling (removing separate enriched seventh‑grade classes) affected outcomes. Dr. Pratt said multi‑year trends are needed to establish patterns but described two years of local tracking around de‑leveling: students who previously would have been in enriched classes "maintained" their percentile rankings after de‑leveling, and some student groups showed increased percentiles. She emphasized that with only two years of data the district cannot claim causation.
Committee members pressed on how MAP results are used. Dr. Pratt said percentiles compare students to national same‑grade peers and that MAP is one of several data points used to make support decisions. "MAP results are one piece of data that we consider when we are thinking about additional or ancillary supports," she said, noting the district typically triangulates roughly three measures before assigning targeted interventions. She described tiered strategies: ensure access to challenging, standards‑aligned grade‑level work with appropriate scaffolds; provide small‑group or targeted instruction for students below the 40th percentile; and monitor progress every 3–6 weeks.
Dr. Pratt outlined next steps and supports: a winter MAP testing window opens Jan. 12 and closes around Jan. 23 for makeups, the district will compare fall, winter and spring results to track growth, and a MAP trainer will visit in early February to provide a data‑analysis workshop for instructional leaders and teachers.
Procedurally, the committee approved minutes from the Oct. 14 and Nov. 11 meetings at the start of the session.
The committee requested follow‑up reports on year‑over‑year trends and on how the district will evaluate whether targeted interventions narrow the identified gaps. The next Educational Affairs Committee meeting is scheduled at the middle school at 6 p.m.