Supervisor Hancock Cook urges caution on charts, sample size and AI when evaluating county data
Summary
Supervisor Hancock Cook told the Winnebago County Board to scrutinize axes, sample sizes and hypotheses behind charts, urged use of confidence intervals and recommended staff and Forward Analytics as resources for data evaluation.
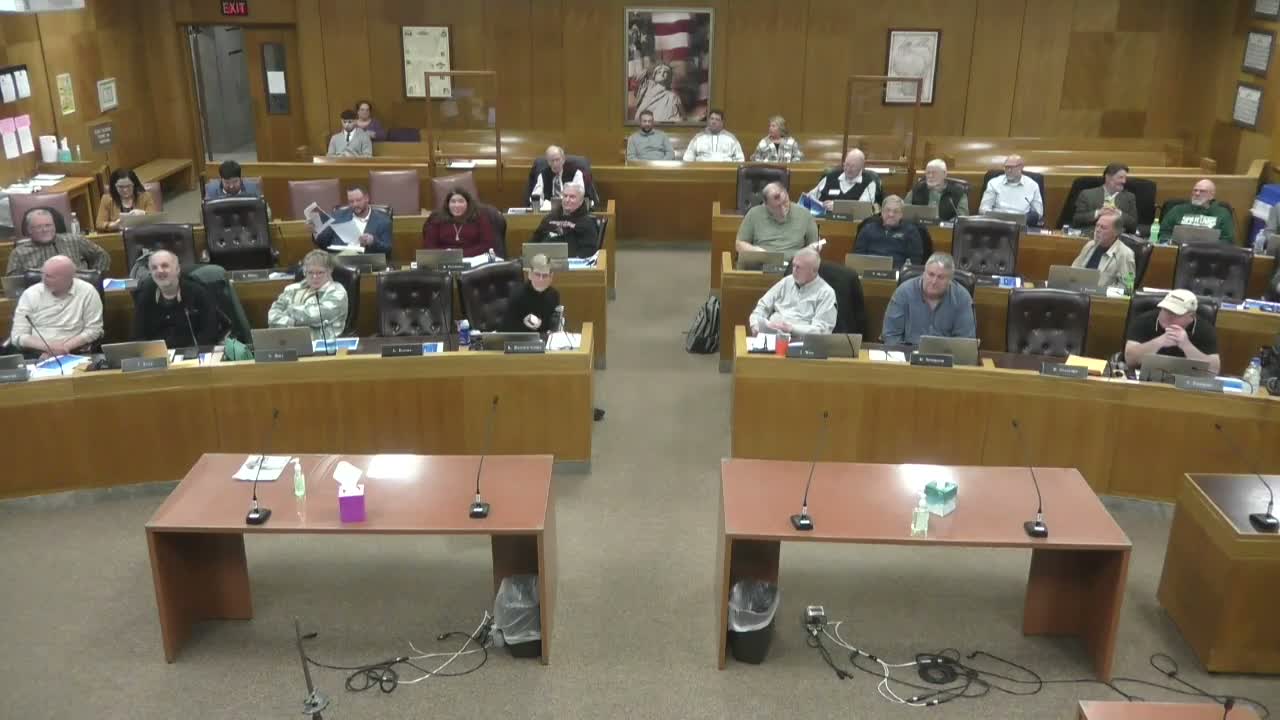
At its meeting, the Winnebago County Board heard a presentation from Supervisor Hancock Cook urging officials to scrutinize data presentations for readability, sample size, statistical significance and bias.
Hancock Cook demonstrated common pitfalls in data visuals, including truncated y-axes that exaggerate differences and the absence of denominators for percentage values. "Can anybody read the y axis on this graph?" she asked while showing an example, and later noted that using the full axis and providing absolute values improves clarity. She demonstrated error bars and explained that overlapping 95% confidence intervals mean differences are not statistically significant.
Why it matters: Cook said decisions informed by misread or incomplete data can mislead policymakers and the public. She emphasized asking what hypothesis the data intends to test, whether sample sizes are sufficient and whether collection methods are comparable. "If you only ask four people, I might have a different answer than if I asked 600 people," she said, urging staff to include denominators with percentages and to cite original sources.
Practical guidance and resources: Cook recommended Front (Forward) Analytics materials and county data staff as resources, offered to share slides from a Forward Analytics workshop, and advised treating AI as a tool to find source material rather than as a generator of final answers. Supervisors thanked her and several raised questions during the discussion; no board action was required.
The presentation concluded with an offer to provide the original Forward Analytics presentation and a reminder that staff may assist with evaluating data for county decisions.