Committee hears that salaries and benefits dominate K–12 spending; ESSER funds eased but may worsen fiscal cliff
Get AI-powered insights, summaries, and transcripts
Subscribe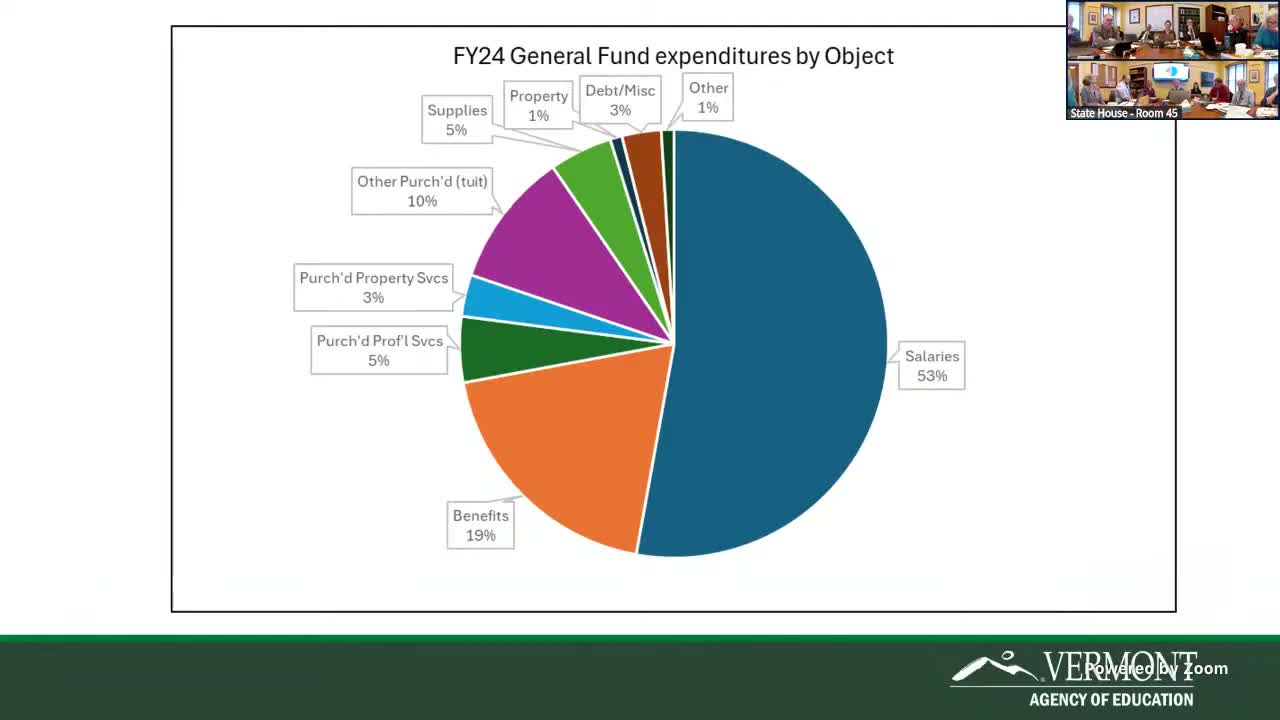
Summary
Agency told the committee that salaries and benefits make up roughly 70% of districts' general fund spending and grew ~39.5% from 2020–2025; members said ESSER and temporary COVID funding raised spending then declined, leaving fiscal‑cliff risks.
Agency staff reviewed object‑code spending and identified salaries and benefits as the largest share of district general fund expenditures, accounting for about 70 percent. The Agency presented a five‑year growth analysis (2020–2025) showing wages and benefits grew significantly — salaries were reported to have increased roughly 39.5% over that period — while the full composition of those increases (fewer FTEs but higher total salaries due to cost‑of‑living and step increases) warrants further object/function breakout.
Business managers and committee members said key cost drivers include negotiated salary increases, health‑insurance premiums and rising tuition costs (including CTE and nonpublic tuition). The Agency said salary and health‑insurance components are often negotiated outside a single collective bargaining instrument, reducing negotiators' levers and complicating district budgeting.
On federal pandemic funds, Agency staff said the state received roughly $500 million in ESSER and related COVID funds; federal funding temporarily increased the federal share of per‑pupil spending to about 12% at the peak and is now back near 9%, but members warned many districts sustained staffing and recurring costs begun during the ESSER period and face a fiscal cliff as those funds expire.
Members requested the Agency provide FY25 data soon, a more granular breakdown of salary/benefit object codes (including health‑insurance detail), and district‑level tuition and CTE cost trends.