Get Full Government Meeting Transcripts, Videos, & Alerts Forever!
Get email alerts on the Transit Study topic
No spam. Unsubscribe anytime.
Research presentation compares small-urban transit performance across the Upper Midwest and Great Plains
Summary
An Upper Great Plains Transportation Institute study reviewed service availability and performance across small urban systems, finding many systems operate 60-minute headways, limited Sunday service, and wide variation in coverage and efficiency; the study used coverage, span and frequency as primary metrics.
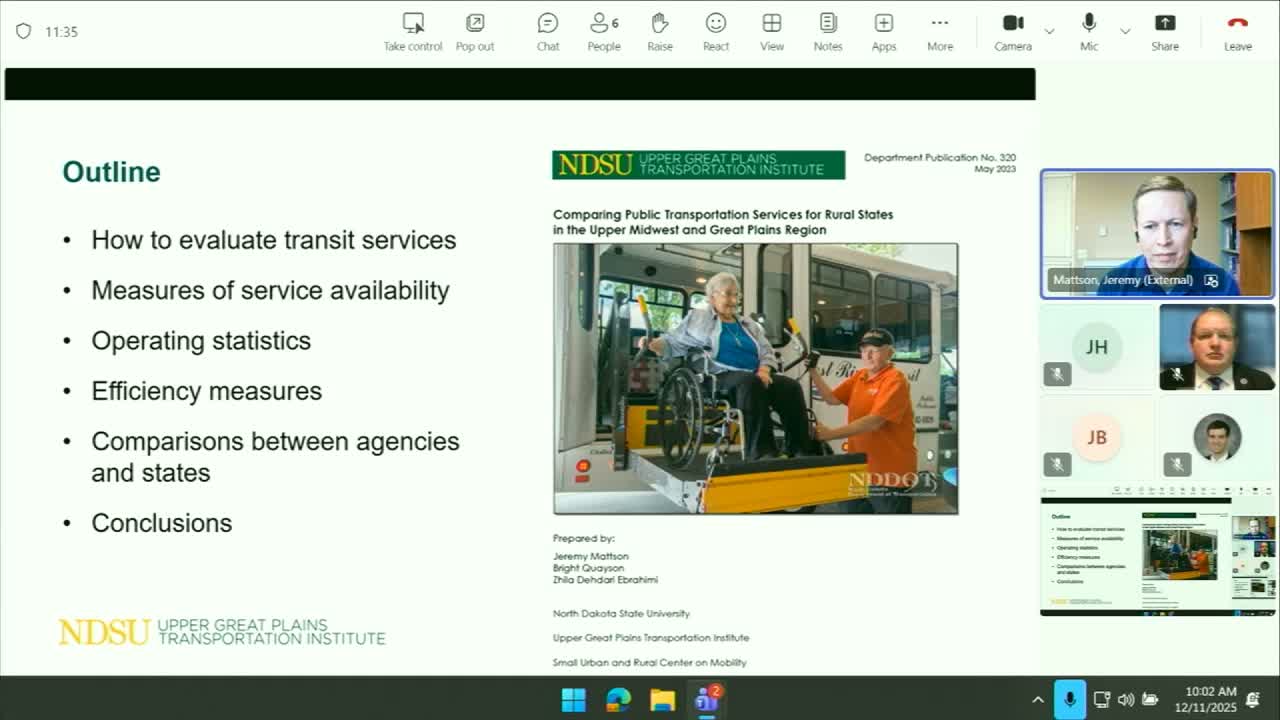
An institute researcher presented a comparative study that measured how small urban transit systems in the Upper Midwest and Great Plains perform on availability and basic efficiency metrics. Jeremy Mattson of the Upper Great Plains Transportation Institute told the subcommittee the May 2023 study (with select 2024 updates) compared fixed-route and demand-response systems in cities including Fargo, Grand Forks and Bismarck, and compared them with small urban systems in neighboring states.
Mattson said the analysis focused on availability — whether a system takes riders where and when they want to go — using span (hours and days of service), frequency (headways), and geographic coverage (share of population within a quarter mile of a stop). "The first two are the most important, like it takes me where I want to go and when I want to go," he said. He reported that many small urban systems commonly used 60-minute headways, with some routes in Fargo running 30 or 15 minutes during peak periods.
The study mapped stop coverage and calculated population access: Mattson reported MAT bus (Fargo–Moorhead) served about 62% of its population within a quarter mile of a stop, Grand Forks about 82%, while Duluth and Missoula approached roughly 90% coverage in the comparisons he presented. He cautioned that GIS data were not available for every system in the study and that some system service patterns may have changed since data collection.
On operating performance, Mattson presented ridership trends beginning in 2019, showing pandemic declines followed by recovery through 2024; per-capita ridership and metrics such as vehicle revenue miles and hours were used to normalize comparisons among differently sized areas. He emphasized that systems with a larger share of demand-response service (paratransit) will show higher cost-per-trip and lower productivity metrics than systems emphasizing fixed-route service.
Mattson concluded that North Dakota agencies were generally middle-of-the-pack on many measures compared with neighboring states. "Some agencies stand out as having higher levels of service," he said, citing examples in Minnesota and Montana, and he noted the study did not evaluate unmet needs (which agencies document in local transit development plans).
The subcommittee asked whether the study had been updated beyond 2023; Mattson said he updated some 2024 operating statistics for the presentation but did not conduct a comprehensive update. He also confirmed that local agencies or the subcommittee could supplement the study with more recent or locally specific data.
Next steps noted by staff include inviting the remaining two major providers (Grand Forks and Bismarck) to present at a subsequent meeting so the subcommittee can compare the four urban providers directly.