Get Full Government Meeting Transcripts, Videos, & Alerts Forever!
Get email alerts on the Energy Dashboard topic
No spam. Unsubscribe anytime.
Borough debuts public energy-usage dashboard to track municipal facilities
Summary
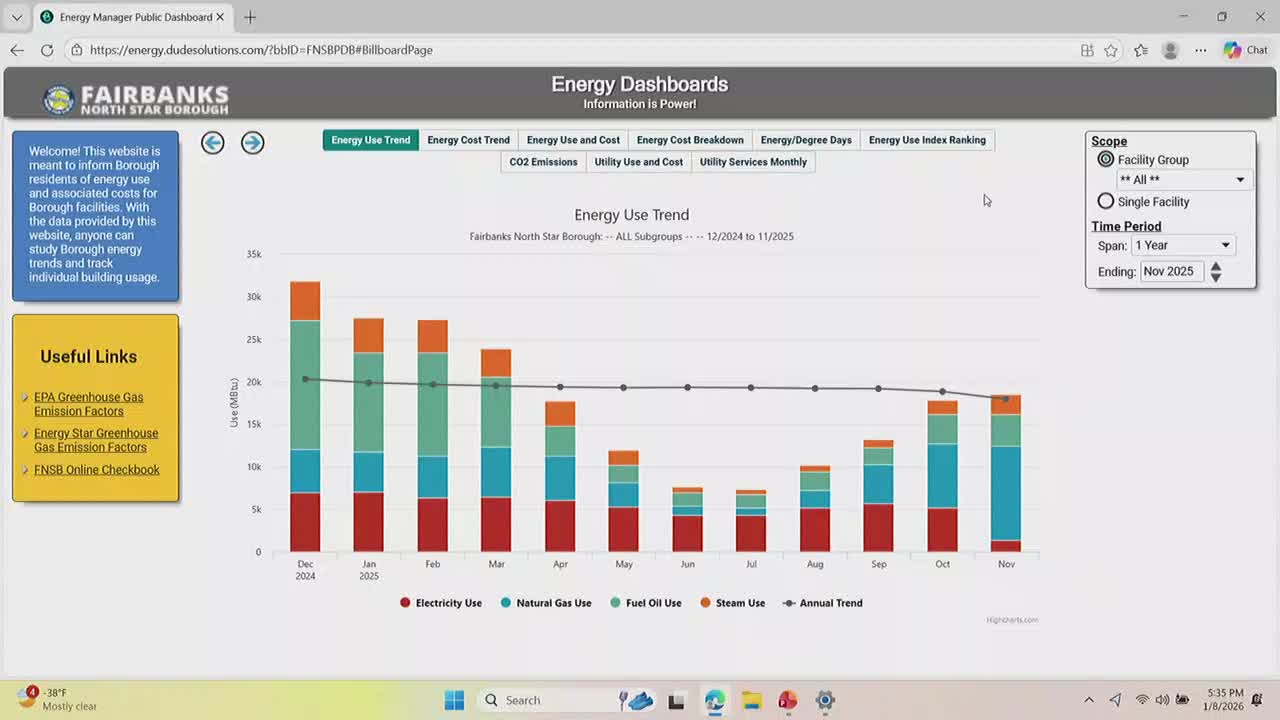
The borough introduced an interactive online energy dashboard that combines borough and school district utility data, shows trends, cost breakdowns and a carbon-footprint view, and can report data back up to about 20 years; staff will add more facilities and a public feedback button.
The Fairbanks North Star Borough on Jan. 2026 demonstrated a new online energy-usage dashboard intended to make municipal and school-district utility data more accessible to officials and the public.
Mark Nelson, the borough’s asset and energy systems specialist, walked the assembly through the dashboard’s features, saying it displays combined borough and school-district energy use, an annual trend line, fiscal-year toggles, per-facility views and downloadable reports. “This here is the dashboard. So it's kind of interactive. You can search through different items on it,” he said. Nelson showed cost breakdowns, an energy-use index for comparing building performance per square foot, and a carbon-footprint panel that draws on standard emission-factor sources.
Council members pressed on comparability between different pool facilities, how CO2 emissions are calculated and where the data comes from. Nelson said the dashboard draws from the borough’s Energy Manager software (formerly a Dude Solutions product) and that staff enter utility bills into the system so the dashboard updates automatically; he noted the dashboard can be set to show roughly 20 years of historical data and links to EPA and Energy Star greenhouse-gas emission factors for methodology. Staff agreed to explore adding a dedicated public feedback button and to expand facility coverage (for example, additional parks and transit-related buildings) over time.
Why it matters The dashboard lets officials and residents review energy use and cost trends across municipal operations and compare facility performance. Assemblymembers said the tool could help evaluate whether past efficiency projects delivered expected savings; staff confirmed they use it to track outcomes such as LED lighting retrofits.
Next steps Staff said they will circulate a link to the assembly and will continue to add buildings and features, and will look at adding an easy feedback form on the public page.