Weston School District presents midyear math and reading snapshot; subcommittee pauses after quorum lost
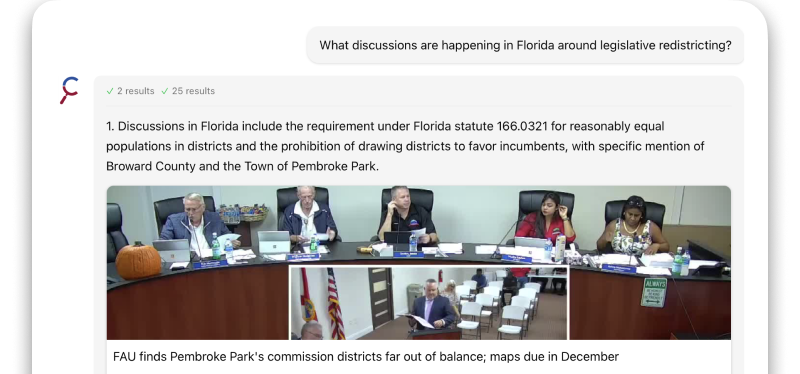
Summary
The Weston School District curriculum subcommittee heard a midyear snapshot of math and reading assessment results and professional development progress on Feb. 4, 2026; the session ended early after the group lost quorum and agreed to reconvene in March to review subgroup and longitudinal data.
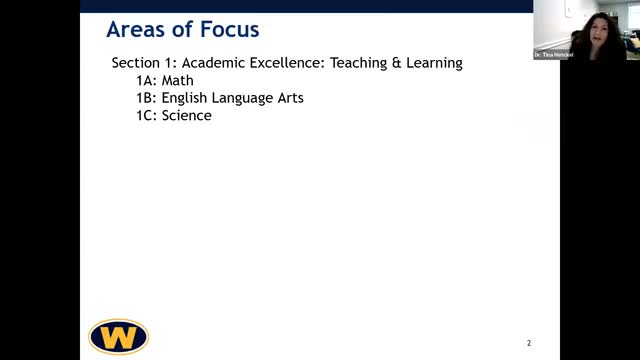
Speaker 1, the presenter for the Weston School District curriculum subcommittee, told members on Feb. 4 that the district’s midyear assessment window is mostly complete and that the snapshot focuses on grade-level achievement in math and reading.
The presenter said the assessment window remains open but that "about 90 to 95% of our students are completed," and emphasized this report covers fall-to-winter achievement while subgroup and growth analyses will follow in the spring once testing is finalized.
The snapshot centered on two commonly used measures: NWEA MAP Growth for math and reading and DIBELS 8 for foundational early-literacy screening. "We use NWEA MAP Growth as a predictability tool" for state tests such as Smarter Balanced, the presenter said, and cited linking-study correlations for reading (about 0.84–0.85) and higher correlations in math (up to about 0.88–0.91).
On elementary math, the presenter reported high rates of meeting benchmarks in the earliest grades, saying "we have 92, 93, and 95% of our students across K1 and 2 that are meeting or exceeding the benchmark expectations." For grades 3–8, the district uses a higher percentile target (roughly the 60th–61st percentile on NWEA) as an indicator that students are on track for a Smarter Balanced level 3 by year’s end.
The presenter flagged a particular dip in sixth-grade math and attributed part of the drop to curriculum timing: "statistics is one of those units we don't teach until closer to spring," she said, and recommended unpacking curriculum alignment to determine whether instruction timing or pacing explains the lower domain scores.
District leaders also described professional-development supports tied to curriculum changes. The presenter said Illustrative Math is in early stages of implementation in several grades (first year in grades 1, 3 and 4; second or third year in others) and that the district has provided or scheduled roughly 13 math-related professional-development sessions by February; literacy supports include a reported 16 PD sessions and coaching cycles tied to the American Reading Company core program.
During questions, Speaker 3 asked whether the readiness percentages reflect cohort history and differences across schools (noting lower percentages at one school compared with another). The presenter replied that cohort tracking occurs at the school level when data are imported into the district’s visualization tools, and that the snapshot is a point-in-time tool used for immediate instructional planning.
Because a committee member had to leave, the subcommittee lost quorum. Members agreed not to continue substantive business and to reconvene in March, when staff expects to present subgroup and longitudinal analyses. Speaker 3 then moved to adjourn the call, Speaker 2 seconded the motion, and the meeting ended.
The subcommittee plans to return in March with expanded analyses, including subgroup data (special education and other groups) and longer-term cohort views to answer outstanding questions about school-by-school differences.