District reports 90.9% on‑time graduation rate and I‑Ready midyear gains; leaders outline intervention plans
Get AI-powered insights, summaries, and transcripts
Subscribe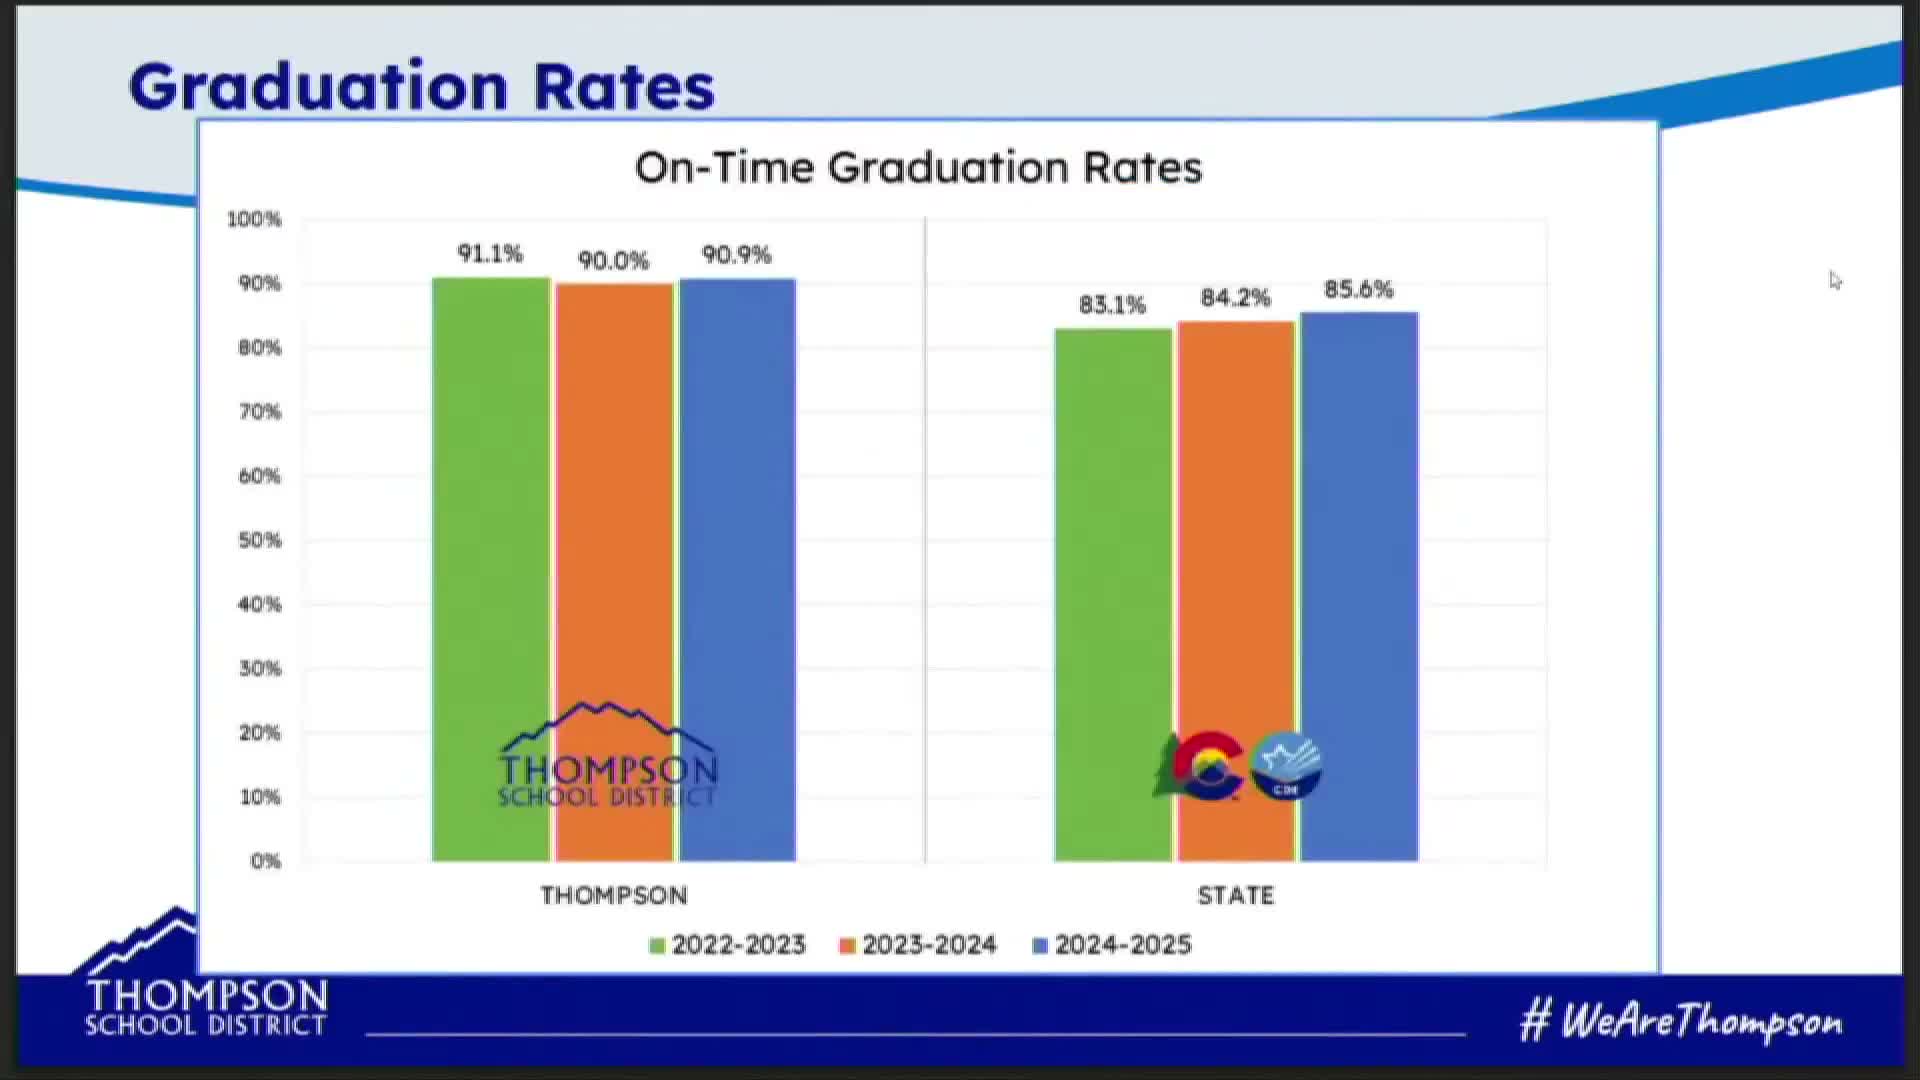
Summary
Thompson School District reported a 90.9% 4‑year on‑time graduation rate for 2025 (above the state) and a 1% dropout rate; learning-services staff presented midyear I‑Ready diagnostic and high‑school benchmark data and described multi‑tiered supports and ALN/UDL professional development.
Thompson School District officials told the board on Feb. 18 that the district’s 2025 on‑time graduation rate was 90.9%, outperforming the state rate of 85.6%, and that the district’s overall dropout rate for grades 7–12 was 1% compared with 1.6% statewide.
Carrie Bartman, director of assessment and evaluation, walked the board through subgroup and school‑level results, noting strong performance for most comprehensive high schools and a different completer metric for the district’s alternative campus, Harold Ferguson, which posted a lower completion rate tied to its alternate education program. Bartman also presented subgroup breakouts (gifted and talented, multilingual learners, students with disabilities) and emphasized that the district remains below state averages in dropout measures across categories.
The learning‑services team then reviewed midyear I‑Ready diagnostics for K–8 and a high‑school benchmark pilot using released PSAT/SAT items. Bartman said the district is seeing fall‑to‑winter growth in both reading and math, with many grade‑levels showing high performance and growth in the quadrant analysis. For example, the high‑school pilot found that 54% of freshmen had mastered the evidence‑based reading and writing benchmark by midyear; growth measures also showed percentage‑point gains between fall and winter cohorts.
Executive directors Carmen Polka and Brandy Greaves described next steps to leverage the data inside PLCs: curriculum adoption work (Benchmark literacy), teacher and principal coaching, All Learner Network (ALN) math strategies and Universal Design for Learning (UDL) training to reduce barriers in instruction. Board members asked for school‑level breakdowns, end‑of‑year comparisons and clearer links to budget priorities so that the board can consider targeted resource allocations.
District leaders said more detailed data (per school, by standard area) are available and that staff will provide additional slices of the data to inform budget and program decisions.